Exhibits 1.16-1.25 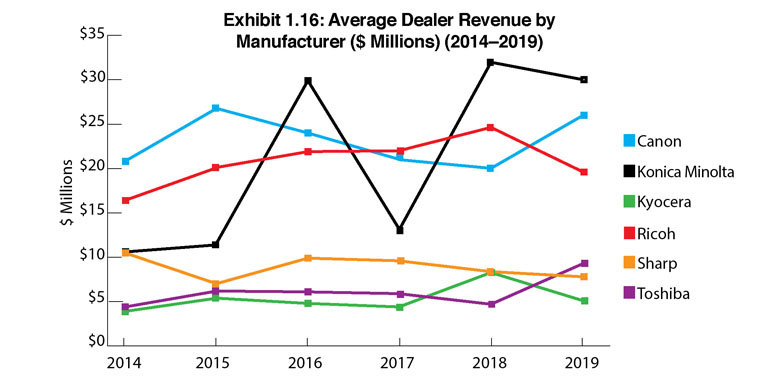
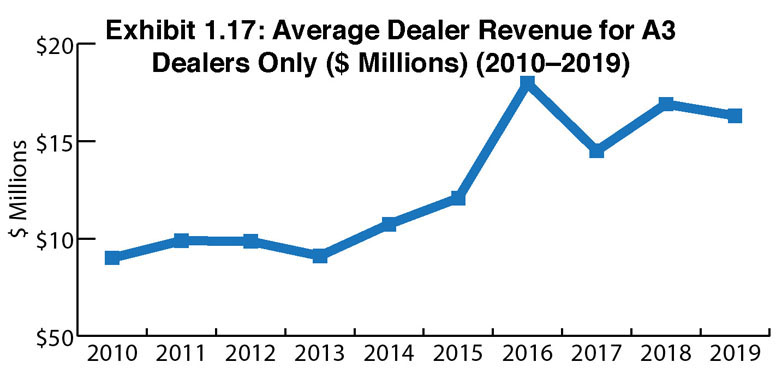
When analyzing our Survey results, we do not base our findings on profitability and choose to examine revenue. This year, the total dealer revenue of our entire universe of respondents was $5,608,696,647, a modest decrease from last year’s $5,717,370,000. The average dealer revenue in this year’s Survey is $16.3 million (Exhibit 1.17), down from last year’s $16.9 million. When tabulating overall dealer revenue we included all 344 respondents, not just the Big Six. This year, one of the eight dealers outside the Big Six, an HP dealer, reported revenues of $113 million.
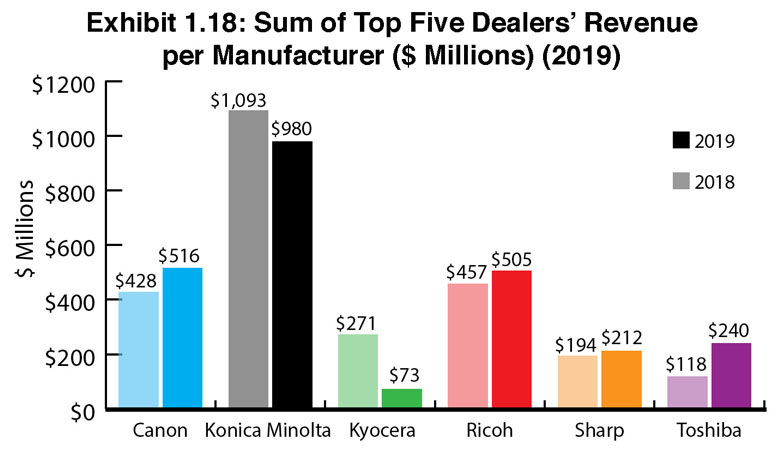
 Konica Minolta dealers remain the most profitable with average revenues of $30 million (Exhibit 1.16). Two reasons for that distinction are two dealer respondents who reported more than $300 million in revenues. The second and third most profitable dealers represent Canon and Ricoh, $26 million and $19.6 million, respectively. Last year, those positions were reversed with Ricoh dealers finishing in second place with $24.63 million average revenues and Canon dealers at $20 million. We attribute the decline in average revenues for Ricoh dealers to a larger pool participating in this year’s Survey, including more dealers with revenues of less than $10 million.
 Exhibits 1.20 to 1.23 examine dealer revenue average percentage increases and decreases, as well as the percentages of those increases and decreases. Overall, the average revenue increase for dealers representing the Big Six was 14.3%, up from 10.8% in 2018. Those experiencing a decline in revenues experienced a modest drop from 10.2% in 2018 to 9.8% in this year’s survey. The revenue increase for the Big Six (3.5% over the previous year) can be attributed to the performance of some of the larger dealers who continue to grow organically and through acquisition. Surprisingly, another reason for the increase might be the result of growing hardware business for some select dealers in contrast to what many of their peers are experiencing. We wouldn’t count on that trend continuing for most dealers as businesses continue to print less.
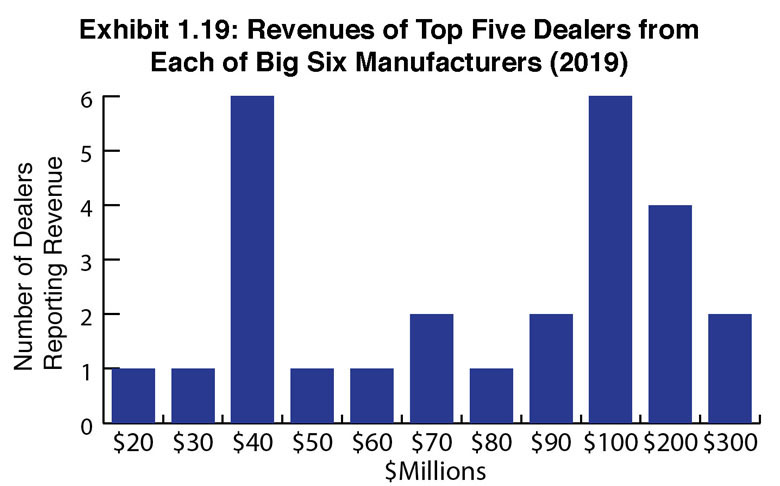 In past years, we described the sweet spot of dealer distribution in the $10 to $20 million range. Last year, we decided to expand that sweet spot to $10 to $30 million. In our view, expanding the sweet spot offers a more accurate representation. Seventy-two (21%) of the 344 dealers participating in the Survey fall into this sweet spot. Canon had the most dealers in this category with 19 (44%), followed by Ricoh with 17 (25%), and Konica Minolta with 11 (22%). Rounding out the Big Six, Sharp had 9 (13%) dealers in this category, while Kyocera had 8 (13.4%) and Toshiba 7 (13.2%).
Last year, we speculated that the decline in dealers within the $10 to $20 million sweet spot may be attributed to acquisitions, which would make dealerships in that revenue range a sweet spot for those looking to acquire as well. Although we’ve seen some dealers in that range and even larger be acquired over the past two years, most acquisitions during the past two years were primarily of dealers with revenues of $5 million and under. For the record, 38 (11.3%) of the 336 Big Six dealers who participated in the Survey reported revenues of more than $30 million. Looking across the entire universe of 344 respondents, 39 dealers (11.34%) reported revenues of more than $30 million.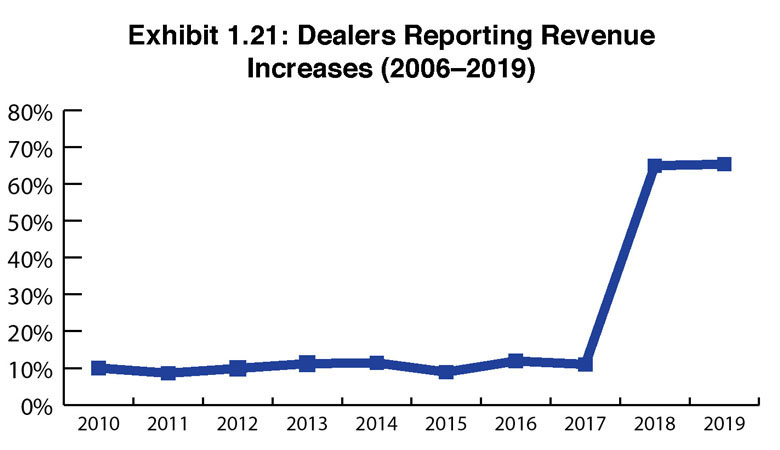
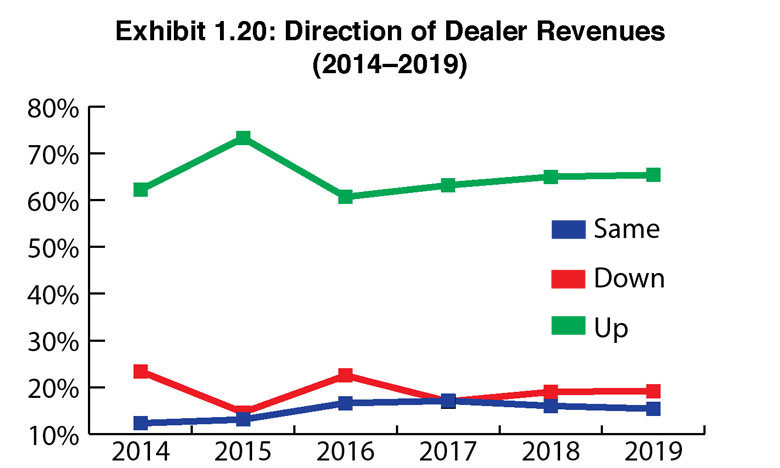
In Exhibit 1.20, we track the direction dealer revenues are heading and found revenues are up for 65% of respondents in this year’s Survey, identical to 2018. Overall, that’s positive news for an industry either exploring new and exciting ways to grow revenues or somehow finding ways to grow revenues in their core MFP business. The percentage of dealers who told us their revenues were flat didn’t change from the previous year (19%).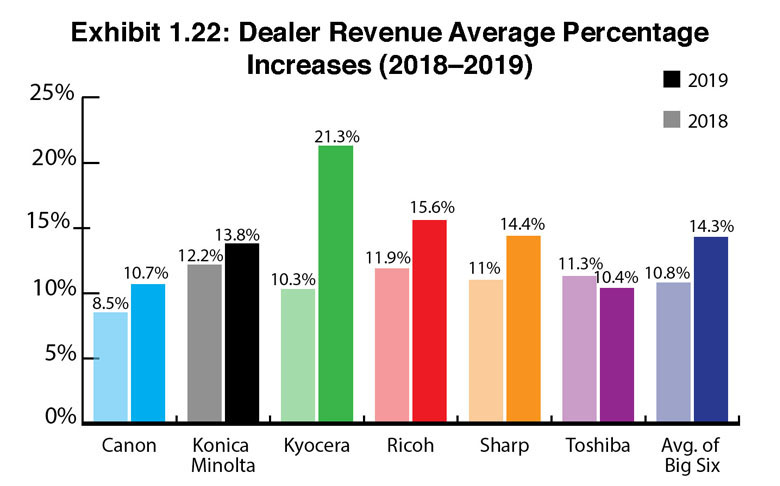
For 15% of dealers responding to our Survey, revenues were down. This is a tough business and a challenging time as dealers are taking on new products and perhaps losing money as they navigate the challenges of selling these new offerings and solutions. Or they are seeing revenues on the decline because they are still enamored with the traditional MPS business, which as we keep reporting, is challenged by tighter margins and declining print volumes. In an industry where acquisitions are prevalent, those dealerships who are reporting declining revenues could very well be thinking that this is the time to start shopping their dealership around. While some companies such as Visual Edge have told us they don’t buy distressed assets, other acquirers are not so picky and are looking to add MIF or have strategies for turning those distressed assets around.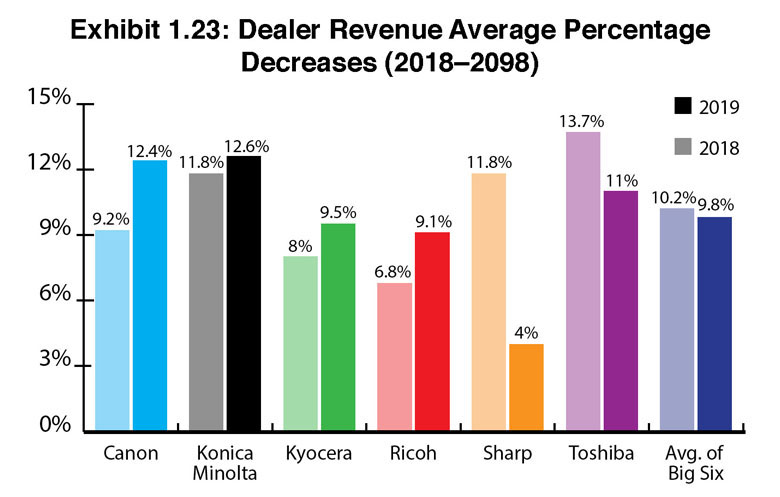
Examining the average percentage of revenue increases (Exhibit 1.22), growth ranged between 10.4% and 21.3% across dealers from the Big Six in this year’s Survey with some of the increases in sharp contrast to last year. The revenue increase for Kyocera dealers was more than double (21.3%) what it was a year ago (10.3%). That percentage includes three dealers who reported revenue increases of 50%, 100%, and 112%, respectively. If we were to remove those three dealers from the equation, it would be closer to what we deem a more realistic percentage (14%). That’s still almost 4% better than the previous year. We can’t attribute either increase to the introduction of a production print device in 2018 because dealers were still not selling it while we were compiling the Survey, and based on anecdotal evidence, Kyocera dealers are not killing it with the Hyland ECM product either. More than likely, these dealers are experiencing increases in their core hardware business as well as with products from the other OEMs they represent.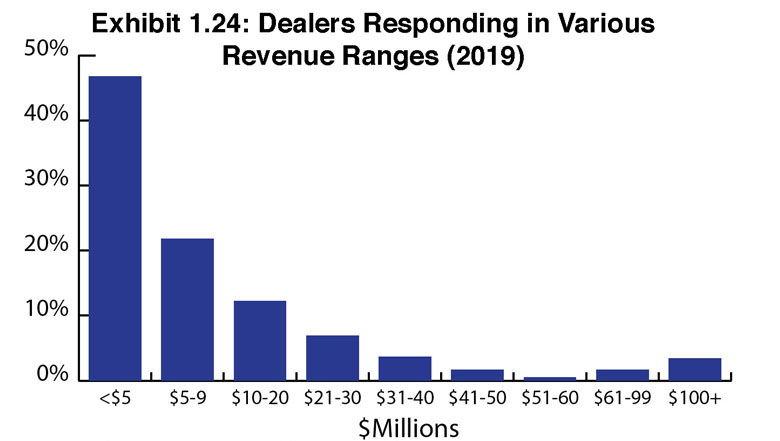
Ricoh and Sharp dealers also reported significant gains in revenue compared to the previous year with Ricoh dealers reporting 15.6% revenue growth compared to 11.9% in 2018, and Sharp dealers reporting 14.4% revenue growth compared to 11% in 2018. The only dealers not reporting an increase in revenues were those representing Toshiba. These dealers experienced a modest decrease from 11.3% in 2018 to 10.4% in this year’s Survey.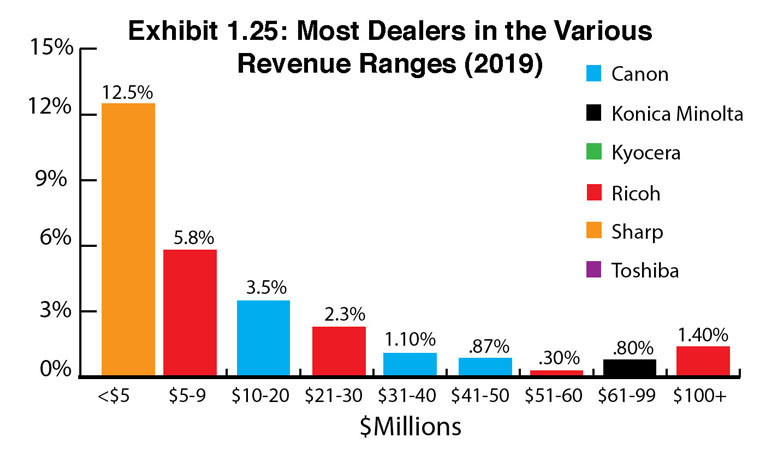
Of those dealers reporting decreases, the average percentage decrease (Exhibit 1.23) was higher than last year for Canon, Konica Minolta, Kyocera, and Ricoh dealers. The revenue decreases for Sharp and Toshiba dealers were not as bad as last year with Sharp dealers reporting an average percentage decrease of 4% compared to 11.8% last year, and Toshiba dealers reporting an 11% average decrease, compared to 13.7 in 2018. Only 15.4% of dealers participating in our Survey reported revenue decreases.
Larger dealers continue to grow their revenues which isn’t surprising considering they have the resources to invest in talent and new opportunities. In 2017, we predicted most dealers with revenues above $50 million would continue to see their revenues increase, and the number of $100 million and $200-plus million dealers in the overall dealer population would continue to grow. This year, we had 7% of dealers (21) report more than $50 million in revenues. Among that group, 90% (19) reported revenue increases while none experienced a decline, and 10% (2) said their revenues were the same as the previous year.
Access Related Content
Visit the www.thecannatareport.com. To become a subscriber, visit www.thecannatareport.com/register or contact cjcannata@cannatareport.com directly. Bulk subscription rates are also available.


