Exhibits 1.37-1.39

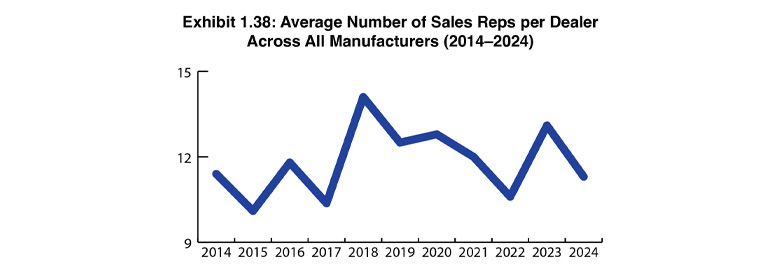
Exhibit 1.38 shows the average number of sales reps per dealer across all manufacturers. We started presenting this data in 2009. Since then, we’ve seen a series of spikes and declines in the number of sales reps per dealer. The highest number of sales reps per dealer was in 2018, when that figure had climbed to 14.1 from 10.3 the previous year. Last year, that number rose to 13.1. Meanwhile, this year, even with a decline in the number of smaller dealers participating in our Survey, that number fell to 11.3. The pandemic impacted the average number of reps per dealer between 2020 and 2022, as some dealerships used this as an opportunity to shed low-performing reps. This period also encouraged some aging reps to retire earlier than they might have otherwise. Not to be overlooked are the hiring and retention challenges prevalent across the office technology industry, particularly in sales, a high-turnover profession. We surmise that more dealers in this year’s Survey are finding that they can do more with less, and the results in this segment of our Survey could validate that trend.

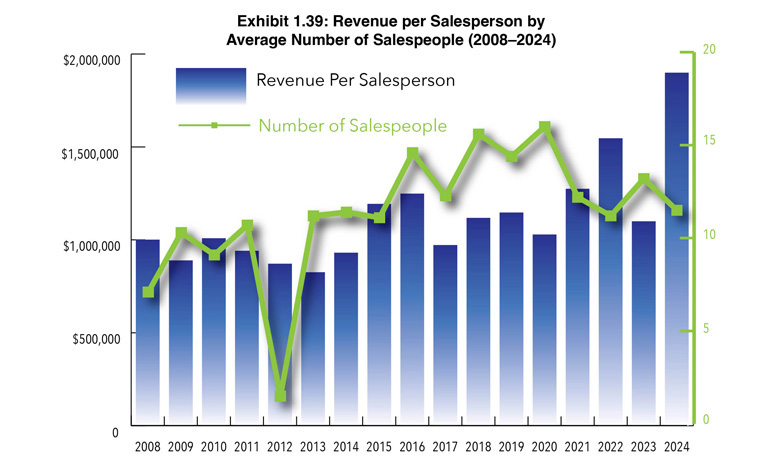
To understand the impact of revenue on productivity, we divide total dealer revenue by the average number of salespeople (Exhibit 1.39). We don’t distinguish revenues from other sources, such as supplies and services. Until three years ago, we included “other” sales or support people for determining the revenue per salesperson. By including “other” sales or support people, we felt the data more accurately reflected the relationship between dealer sales and revenue. However, as we’ve seen a decline in support personnel, particularly around MPS, and now that many dealers have separate divisions for managed IT, we decided that including these personnel in the mix was no longer necessary.

Our goal is to present a simple way to measure sales productivity based on the size of the dealership (number of salespeople) and revenue (Exhibit 1.39). As the number of sales reps has declined, the average revenue per sales rep has risen dramatically, particularly during the past three years. Two years ago, the average revenue per sales rep was $1.5 million. Last year, the average revenue dropped to $1.1 million because of the increased number of Survey respondents, many with revenues of under $5 million. This year, the average revenue per sales rep was $1.9 million, driven in large part by the revenues of the 16 $100+ million dealers represented in our Survey. There’s no underestimating the impact of the $100 million dealers on the channel.


