Exhibits 1.37-1.38
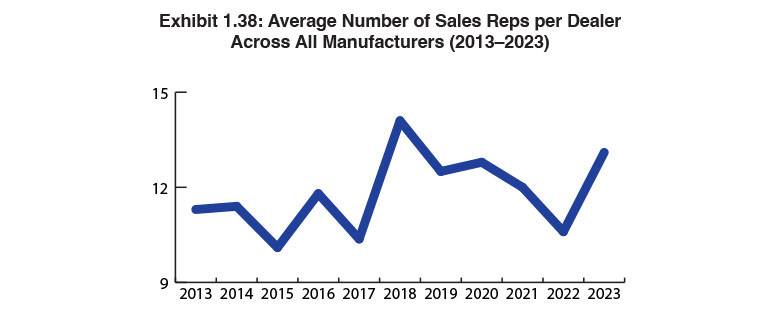
Exhibit 1.38 reveals the average number of sales reps per dealer across all manufacturers. Ever since we first began presenting this data in 2009, we have witnessed a series of spikes and declines in the number of sales reps per dealer, including a significant spike from 10.37 in 2017 to 14.1 in 2018. Last year, that number had fallen to 10.6, while this year—with 18 dealers reporting revenues of more than $100 million and large sales organizations—that number rose to 13.1. No doubt the pandemic had an impact on the average number of reps per dealer prior to this year, as some dealerships jettisoned low-performing reps during this period.

The Great Recession took its toll, too, as aging reps decided to take this opportunity to retire earlier than they might have otherwise. Also, let’s not overlook the hiring and retention challenges common to the office technology industry, particularly sales, which is a high-turnover profession. Although COVID-19 and the Great Resignation are in the not-so-distant past, their impact still reverberates across the independent office technology dealer channel.

To better understand the impact of revenue on productivity, we take total dealer revenue and divide it by the average number of salespeople (Exhibit 1.38). We do not distinguish revenues from other sources such as supplies and services. Up until two years ago, we included “other” sales or support people in the equation for determining the revenue per salesperson. By including “other” sales or support people as an option, we felt the data more accurately reflected the relationship of dealer sales to revenue. However, as we’ve seen a decline in support personnel, particularly around MPS, and now that many dealers have separate divisions for managed IT, we concluded that adding these personnel to the mix was no longer necessary.

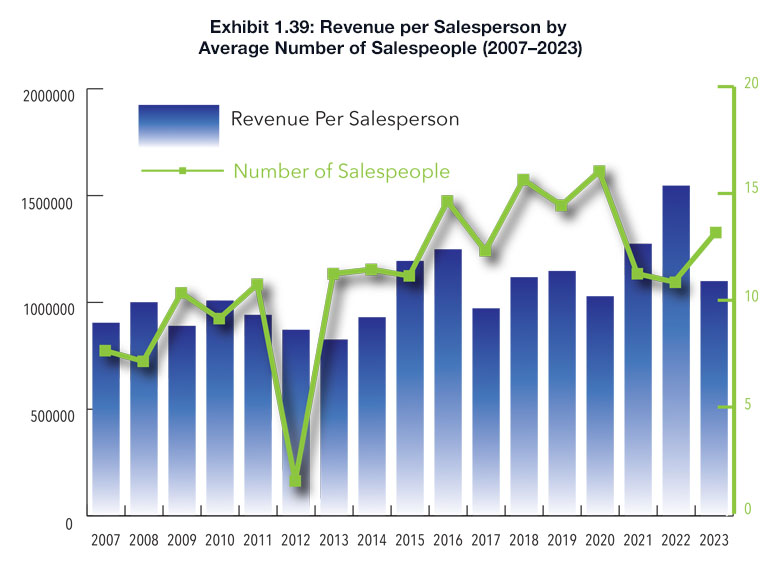
Our intent is to present a simple way to measure sales productivity based on the size of the dealership (number of salespeople) and revenue (Exhibit 1.39). As the number of sales reps has declined in our Survey over the past three years, the average revenue per sales rep has risen dramatically, particularly during the past two years. Last year, the average revenue per sales rep was $1.5 million.
This year, the average revenue dropped to $1.1 million due to the increased number of Survey respondents. This year we wondered what would happen with revenue and productivity if we subtracted the $100 million-plus dealers from the equation. Doing that, we found that the average number of sales reps per dealership would drop to 4.4, and the average revenue per dealer would fall dramatically to $715,100 per sales rep. Once again, there is no underestimating the impact of the mega dealer on the office technology dealer channel.


