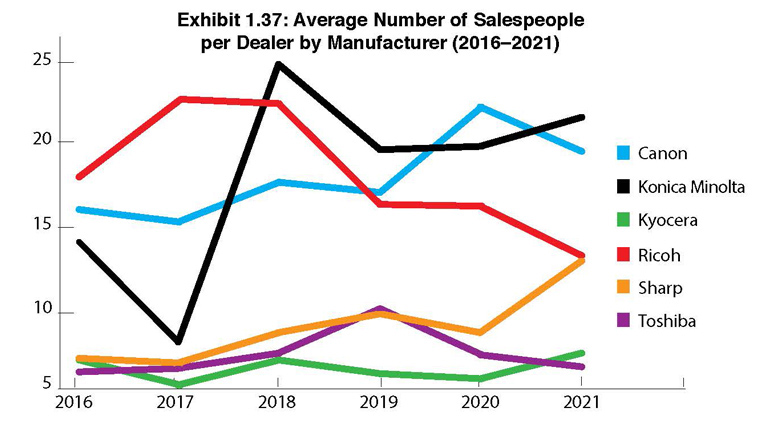
Exhibits 1.37-1.39
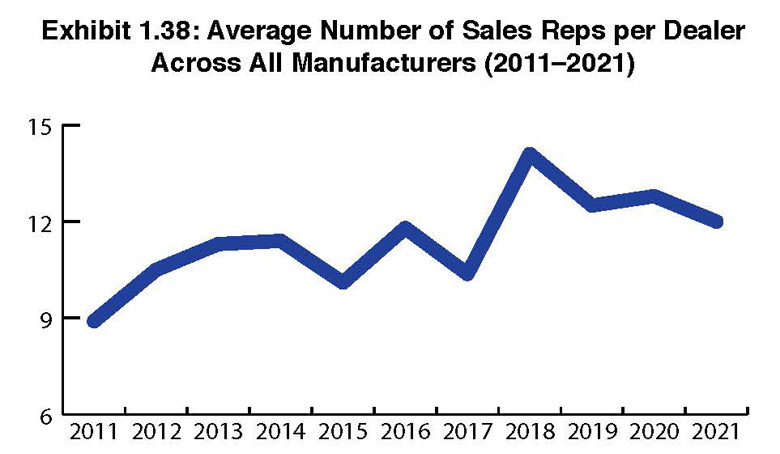
Looking at the employee side of the business, Exhibit 1.38 details the average number of sales reps per dealer across all manufacturers. We began showing this data in 2009 during the economic downturn. Looking back, we saw a sharp spike in the average number of sales reps from 2009 to 2010, but then a series of declines and spikes in subsequent years, with a significant spike from 10.37 in 2017 to 14.1 in 2018, up to 12.7 in last year’s Survey, and slightly down to 12.0 for this year. These spikes can be attributed to various factors, but the reality is that sales is a high-turnover profession, and even the most successful dealerships find it difficult to maintain sales personnel. No wonder hiring and retention remains one of dealers’ top three challenges in our Survey. That challenge, probably more than anything else, is responsible for the peaks and valleys in our charts related to the average number of sales reps employed by dealerships.

In 2016, we began examining staff employed by dealerships to provide sales support for MPS and MNS. Over the past few years, we have been seeing a decline in the number of sales support staff for MPS. As MPS has matured and become more commoditized, virtually anyone on a dealer’s sales force can sell it, and the need for a MPS sales specialist is no longer necessary.
To better understand how revenue impacts productivity, we take total dealer revenue and divide it by the number of salespeople (Exhibit 1.38). We do not distinguish revenues from other sources such as supplies and services. In this pandemic year, we saw a slight dip in the number of sales reps for dealers across all manufacturers, from 12.7 to 12. Over the course of 2020, we spoke with numerous dealers, and while many were proud that they did not have to make any long-term personnel reductions, others took this challenging time as an opportunity to cut loose some underperforming reps.
Prior to this year, we included “other” sales or support people in the equation for determining the revenue per salesperson. By including “other” sales or support people as an option, we felt the data more accurately reflected the relationship of dealer sales to revenue. However, as we’ve seen a decline in support personnel, particularly around MPS and that many dealers now have separate divisions for managed IT, we concluded that adding this personnel to the mix was no longer relevant.

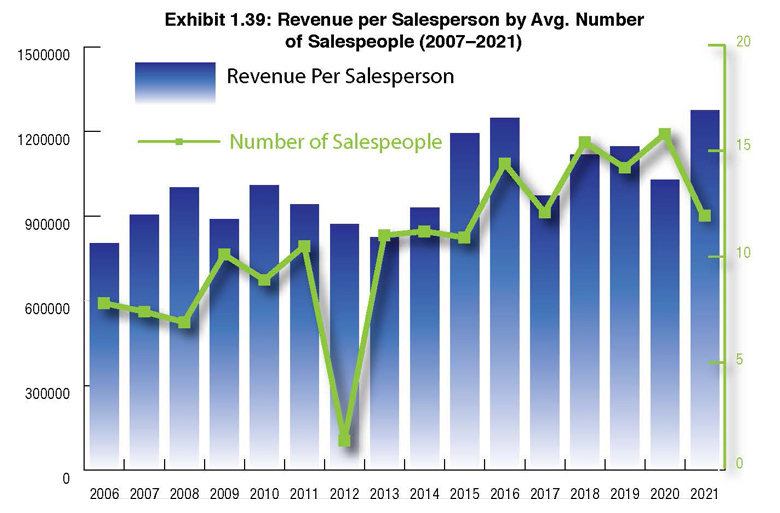
Our intent is still to present a simple way to measure sales productivity and the correlation between the size of a dealer and revenue. Now that we have tweaked our Survey, and despite the revenue losses caused by the pandemic, there is an uptick in revenue per salesperson as shown in Exhibit 1.39.

Using the previous method of including “other” sales support, the average number of salespeople in last year’s Survey was 15.8, which equated to an average revenue of $1,029,162 per sales rep. However, when using our revised method focusing solely on traditional sales reps, the average revenue per sales rep would rise to $1,283,464. In this year’s Survey, the average revenue per sales rep is $1,262,883. Please note that we did not factor in revenues from dealers who did not reveal the number of sales reps they employed, which reduced the overall revenue from $15.3 billion to $15.1 billion. Either way, please allow us this honest transparency. We believe the average revenue per sales rep in this year’s Survey should be significantly lower than that, no matter how many dealers experienced an uptick in business during the latter half of 2020. Creative bookkeeping aside, we estimate the average revenue per sales rep to be under $1 million for 2020. However, Exhibit 1.39 depicts the average based on this year’s Survey submissions and not our best guesstimate.
Pandemic or not, hardware placements continue to trend downward. As a result, sales reps are finding other ways to increase the revenue they bring in for their dealerships. For a better idea of where some of those new ways that sales reps are increasing revenue, please see the Greatest Growth Opportunities section in this Part I of our Survey review.
Access Related Content


