Is a recession looming on the horizon?
Bubbles or unsustainably high valuations in financial assets played key roles in two recent recessions. The “dot-com” bubble in technology stocks contributed to the recession that began in early 2001, and the housing bubble was the main cause of the economic and financial crisis of 2007 and 2008. We finish 2021 with excesses in both the equity and housing markets that rival or exceed the excesses seen in these two prior episodes. The ongoing current booms in the equity and housing markets have driven the value of household assets up sharply. The net worth of American households in late 2021 stood at a level about eight times their disposable personal income. This is well above the peaks seen in prior bubbles.
At the height of the dot-com bubble, the value of corporate equities and mutual fund shares held by households stood at $10.7 trillion. This peak occurred in the first quarter of 2000. The value of these holdings would decline by 44% over the next two and a half years. Now, they stand at over $40 trillion, almost four times their level in early 2000. During the same period, the economy (as measured by GDP) has grown 132%. This divergence is striking. Compared to the peak of the dot-com bubble, equity prices have increased by about 300% (from $10 trillion to $40 trillion), while the economy has grown by 132%. The divergence between equity prices and the size of the economy is much larger now than at the peak of the bubble in technology stocks.
Moving on to housing, at the height of the housing bubble, the value of owner-occupied real estate in the U.S. stood at $24.15 trillion. This peak occurred in the fourth quarter of 2006. It would decline by 25% over the next five years. Today, it stands at $36.81 trillion, more than 50% above the peak at the end of 2006. Relative to the size of the economy, the housing bubble is not yet as big as it was in 2006, but it is approaching that level.
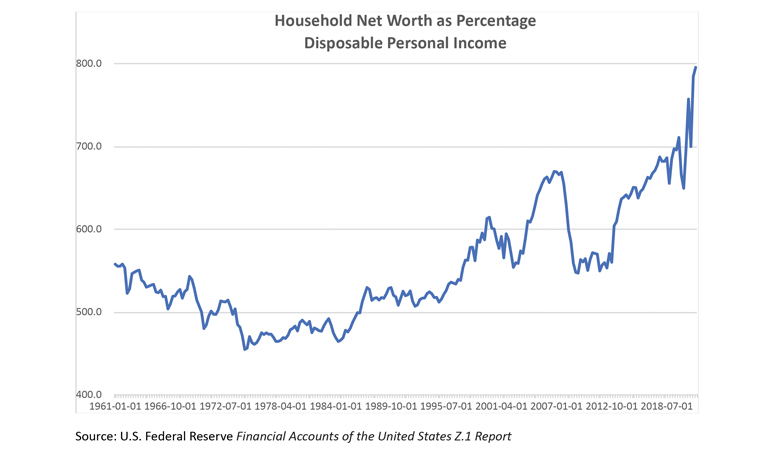
To see how distorted the valuation of assets has become, combine all assets held by households and compare that to GDP or to incomes of households. The assets held by households mainly consist of equities and housing, so the analysis presented above hints at the sort of picture we are going to see. Simply put, the current situation combines the excesses seen in 2000 in the equity market and the excesses seen in the housing market in 2006. The adjacent graph summarizes the situation and shows the ratio of the net worth of U.S. households to personal disposable income.

Source: U.S. Federal Reserve Financial Accounts of the United States Z.1 Report
For most of the second half of the 20th century, household net worth was between 4.5 and 5.5 times personal disposable income. The dot-com bubble brought it to a peak of slightly over six times personal disposable income. The housing bubble created an even bigger distortion, bringing household net worth to a level 6.7 times income. Today, it is about eight times income. Relative to a “normal” ratio of approximately 5.5, the current excesses in asset prices are much larger than in the two prior bubbles. Indeed, it could be argued that the current situation exceeds the combined excesses of those two bubbles.
What causes bubbles to burst? In the case of both the technology and housing bubbles, tightening of monetary policy seems to have contributed. The Federal Reserve Board raised the fed funds rate by 1.75% in the two years ahead of the bursting of the tech bubble, and 4.25% in the two years before the bursting of the housing bubble.
Other factors also contribute to the bursting of asset bubbles. Bubbles are situations in which asset prices far exceed traditional benchmarks. They become divorced from their fundamental anchors such as the size of the economy, income of households, or corporate profits. They grow because certain investors buy on momentum, reasoning that what goes up will continue going up. However, at some point, the number of such investors dries up. When that happens, the process loses momentum, and the bubble bursts.
The larger the bubble, the more destabilizing the aftermath is to the economy. In principle, there is the possibility that excesses in asset prices can be corrected gradually. In reality, the corrections tend to be fairly rapid and the loss of financial wealth large enough to cause economic recessions. In the case of both the technology stock bubble and the housing bubble, the correction brought the ratio of household net worth to disposable personal income back down to 5.5 and occurred within a period of less than two years.
A return to a ratio of 5.5 between household wealth and income would require an even larger loss of wealth than was the case for the prior two bubbles. If it happens in a compressed period (less than two years), it is very likely to be accompanied by a recession. Of course, the timing of any unwinding of the current excesses in the housing and equity markets is highly uncertain. In the prior two bubbles, the peak in financial price excesses occurred about two years after the Fed started raising the fed funds rate. If this pattern were followed, the economy and markets could have two more good years before a correction sets in.
It is worth noting that some of the rise in house prices is due to the pandemic, which has scrambled households’ preferences about location and other aspects of their housing arrangements. This process will continue to play out and adds to the uncertainty regarding the timing of any correction in house prices.
For the Fed, the situation is especially tricky. Inflation is now significantly higher than it was in the latter stages of the technology and housing bubbles. This may lead the Fed to tighten more aggressively than it did during those two cycles. This points to the possibility that the current bubbles in housing and equity prices will start to unwind more rapidly than the prior two, when the peak in asset prices occurred about two years after the Fed started tightening. It is a plausible scenario that the peak in asset prices in this cycle will come in late 2022 or 2023, with a recession beginning in either 2023 or 2024.
Source for data in this column is the Federal Reserve’s report on the Financial Accounts of the United States (also known as the Z.1 report).
Access Related Content


