Exhibits 1.14-1.19

The COVID-19 pandemic significantly impacted dealer revenues in 2020 and 2021. Following the pandemic was the subsequent supply chain crisis, which, much to our surprise, didn’t impact dealer revenues as much as we thought it would. With the pandemic largely behind us and the supply chain flowing, revenues are rising. First, let’s examine how revenues have been trending since the pandemic.
The pandemic negatively impacted average dealer revenues in our 2021 Survey, dropping to $15.3 million from $16.3 million. (Those averages reflect dealers’ performance in 2020, not 2021.) Two years ago, the average yearly revenue attributed to 380 dealers rose by nearly $2 million to $17,017,157, a sure sign of recovery. Last year, that figure grew to $17,211,295. We attributed that increase to the 16 dealers, three more than the previous year, reporting more than $100 million in yearly revenue. Those 16 dealers accounted for 45.2% of all dealer revenue reported in last year’s Survey.
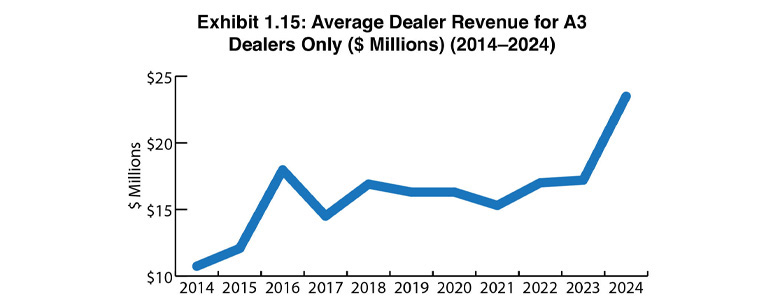
This year, the average dealer revenue sharply increased to $23.5 million (Exhibit 1.15) thanks to 16 dealers reporting annual revenues of more than $100 million and 57 fewer responses than the previous year’s Survey, as many of those dealers not participating in this year’s Survey had revenues of under $5 million. The overall dealer revenue was $9,440,422,069.34. When tabulating overall dealer revenue, we included all 401 respondents, not just the Big Six. Five dealers with annual revenues between $85 million and $94 million also contributed to the increase. Based on the participants in this year’s Survey, the average annual revenue would be even higher because at least three dealers with revenues of more than $400 million didn’t participate in the Survey. Returning to the 16 who did, those dealers are responsible for 51% of all dealer revenues, a notable increase from the previous year.
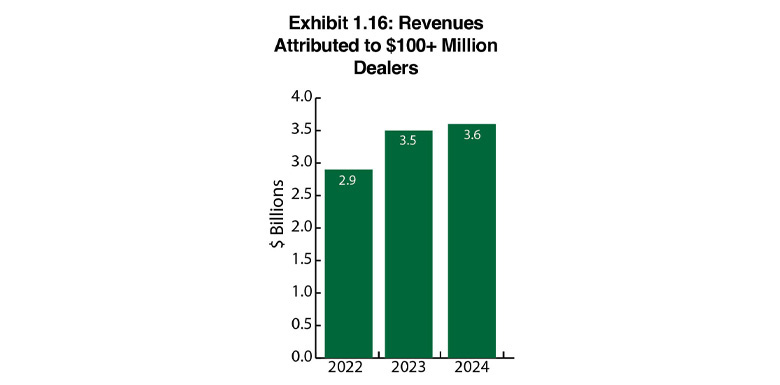
If we subtract those 16 dealers from the overall dealer revenue of 401 dealers, the average dealer revenue would be $15.3 million. That difference illustrates the dominance of the $100+ million dealers. And they’re not going away. The likely scenario is that they’ll continue to grow organically and through acquisition. Should two of those $100+ million dealers merge, an unlikely scenario, but never say never, the impact will likely reverberate across the entire dealer channel.
The growing number of dealers with $100+ million in annual revenue is an important discussion point, but let’s not overlook those with revenues of $10 million or less. They still dominate our Survey. Fifty-one percent of Survey participants reported revenues of $5 million or less, and 17% reported revenues between $5.1 and $10 million. However, until this year, the overall percentage of dealers with revenues of less than $10 million has been shrinking. The percentage was 72% two years ago, and the year before it was 73%. Last year, that percentage had fallen to 68%, the same percentage as this year. We don’t consider the decline a concern because, for the foreseeable future, there will continue to be a place for smaller dealers in specific markets where the mega dealers don’t play and for customers who appreciate doing business with a small local entity running a lifestyle business.
Canon and Ricoh dealers represent the most profitable in our Survey (Exhibit 1.14) in terms of average yearly revenue. Konica Minolta dealers fell from the top spot even though they reported identical average annual revenues for this year—$40 million. Canon dealers led with $44.6 million in average annual revenues, followed by Ricoh dealers at $41.6 million. Last year, Canon dealers reported average annual revenues of $32 million and Ricoh dealers $26.6 million. A contributing factor for all three OEMs is the number of $100+ million dealers. Ricoh had seven, Canon had three, and Konica Minolta had four dealers with revenues of more than $100 million. Kyocera and Toshiba had one each. For the record, the largest Sharp dealer reported revenues of $95 million, so it’s not unrealistic to expect that they’ll have their first $100+ million dealer within the next year or two.
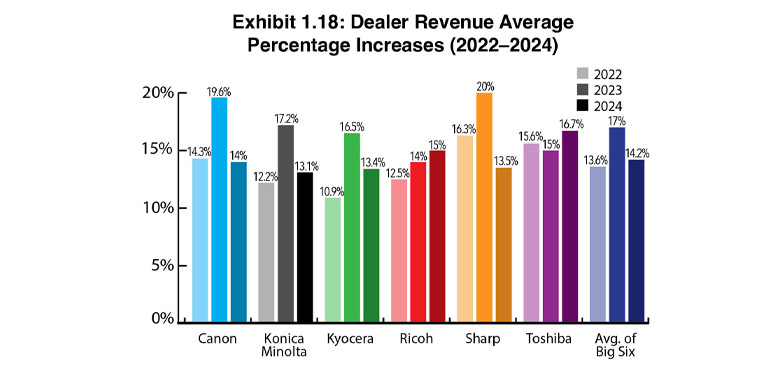
Exhibits 1.18 to 1.19 reveal dealer revenue increases and decreases and the averages of those increases and decreases. Overall, the average revenue increase for dealers representing the Big Six was 14.2%, down from 17% a year ago (Exhibit 1.18). That figure was just 12.2% in our 2021 Survey.
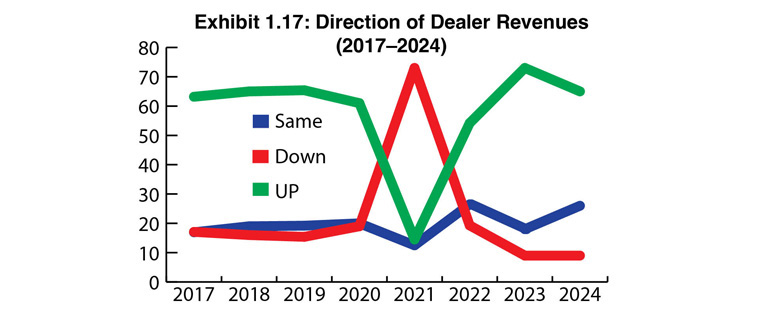
The percentage of dealers reporting revenue increases fell from 73% last year to 65% this year (Exhibit 1.17). The percentage of dealers reporting flat revenues rose from 18% last year to 26% this year. Despite what some industry analysts say about the status quo, it’s not always negative. In this instance, it’s better than reporting a decline in revenues as 9% of dealers did. Two years ago 19% of respondents reported that revenues were down.
The average percentage of revenue increases (Exhibit 1.18) by manufacturer ranged between 13% and 16.7% compared to 14% and 20% across dealers from the Big Six in last year’s Survey. Surprisingly, Toshiba dealers reported the highest average percentage increase at 16.7%, up from 15% a year ago. After reporting the highest average percentage revenue increase for four consecutive years, Sharp dealers’ average revenue increase declined from 20% to 13.5%. Last year, we attributed Sharp’s dealers’ performance to their OEM’s ability to successfully navigate through the supply chain issues of two years ago. However, Sharp wasn’t alone in seeing its dealers report lower revenue average percentage increases from the previous year. Canon, Konica Minolta, and Kyocera dealers all reported declines. Toshiba and Ricoh were the only two OEMs whose dealers reported increases. Looking at the big picture, even though we saw declines, the average percentage increase was still in the double digits, and few businesses in any industry would be disappointed with those results.
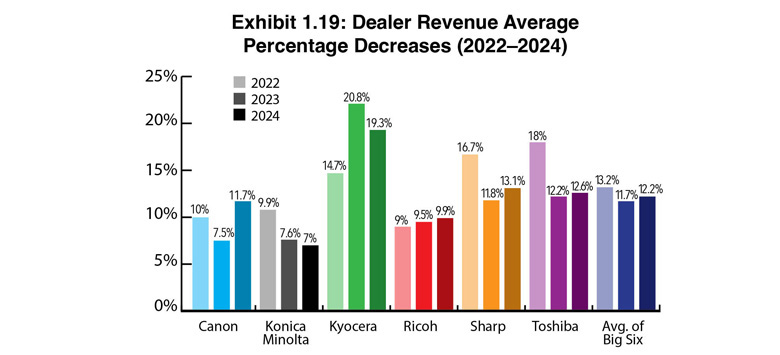
For the 9% of dealers reporting decreases in revenue (Exhibit 1.19), the average of the Big Six increased from 11.7% to 12.2% in this year’s Survey. During the pandemic year, the average revenue decrease was a hefty 18.6%. This year, except for Konica Minolta (7% vs. 7.6%) and Kyocera (19.3% vs. 20.8%), dealers representing all the other Big Six OEMs reported higher revenue average percentage decreases than the previous year. But let’s place these decreases in perspective as they apply to the number of dealers participating in our Survey. The 9% of dealers reporting these declines represents only 36 of the 401 participating dealers.
The revenue results of our 39th Annual Dealer Survey continue to reveal a robust industry that has rebounded from some significant challenges since 2020. Last year, we expressed some concern about the possibility of a recession in 2024, which hasn’t happened as of this writing. Based on the current revenue results, this is still a great time to be an office technology dealer.


