Exhibits 1.14-1.20
If the results of our last two Surveys were sharply impacted by the COVID-19 pandemic, one might think that this year’s Survey would have been impacted by the supply chain crisis. But a funny thing happened on the way to compiling overall dealer average revenues—they’ve been on the rise.
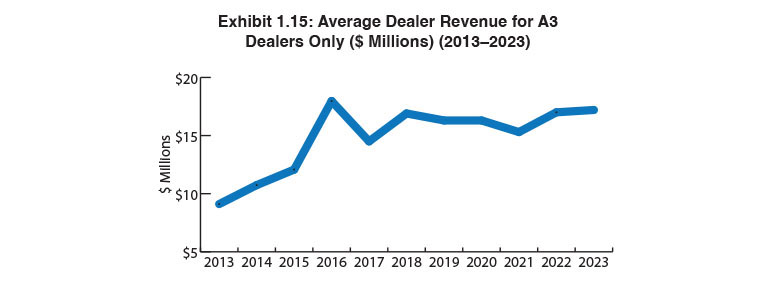
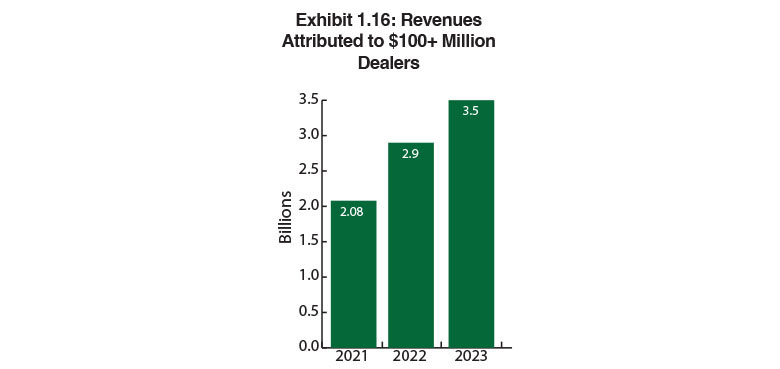
The pandemic took its toll on average dealer revenues in our 2021 Survey, dropping to $15.3 from $16.3 million. (Remember, those averages reflect dealers’ performance in 2020, not 2021.) Last year, the average yearly revenue attributed to 380 dealers rose by nearly $2 million to $17,017,157. And this year, that figure grew to $17,211,295 (Exhibit 1.15). That increase is the result of 16 dealers, three more than last year, reporting more than $100 million in yearly revenues. Those 16 dealers are responsible for 45.2% of all dealer revenues reported in our Survey.
If we were to subtract those 16 dealers from the equation, the average dealer revenue would be $9.7 million. That nearly $8 million difference shows just how dominant the big dealers have become. It wouldn’t be a stretch to predict that those $100-million-plus dealers will continue to get larger. And there may even be more of these mega dealers in the future. Two dealers in this year’s Survey reported revenues of $90 million, and two more reported revenues of $85 and $83 million, respectively.
Another trend related to the growing number of dealers with average yearly revenues of more than $100 million is the increase we are seeing in total dealer revenue. That figure grew from $5.9 billion two years ago to $6.5 billion last year. This year ,it was $7.8 billion. When tabulating overall dealer revenue, we included all 458 respondents, not just the Big Six. Looking at the $7.8 average yearly revenue might prompt one to ask, “What supply chain crisis?” Yes, the supply chain crisis did interrupt the flow of certain products, parts, and supplies, but it didn’t impact services, an area that we surmise helped offset the losses caused by an inability to source and bill for products.
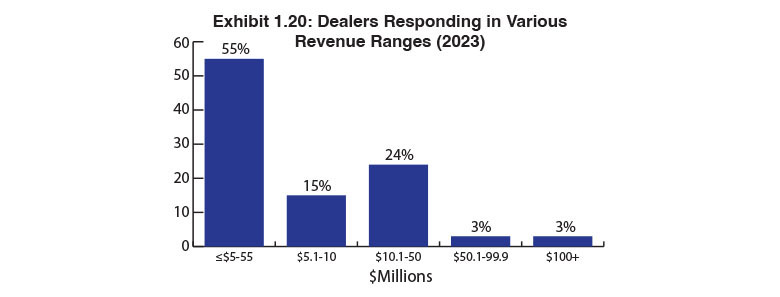
The growing number of $100-million-plus dealers is a great conversation starter, but let’s not overlook those dealers with revenues of less than $10 million. They still dominate our Survey. Fifty-four percent of Survey participants reported revenues of $5 million or less, and another 14% reported revenues between $5.1 and $9.9 million. However, the overall percentage of dealers with revenues of under $10 million is shrinking. Last year, the percentage was 72%, and the year before it was 73%. Today, that percentage has fallen to 68%, still significant but somewhat concerning, especially since most acquisitions continue to be of dealers with well under $10 million in yearly revenues.
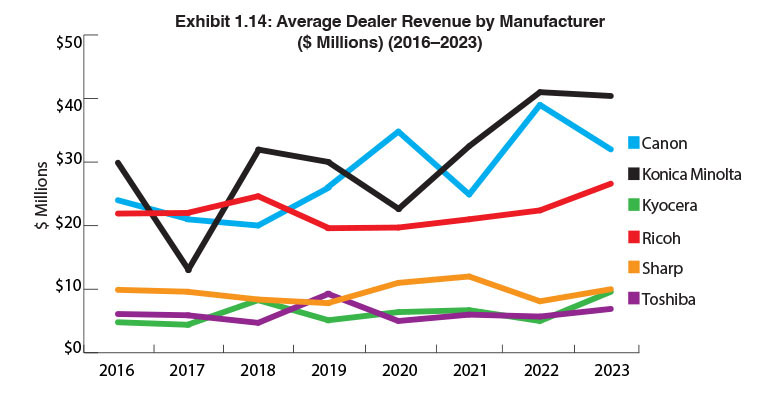
Once again, Konica Minolta and Canon dealers represent the most profitable dealers in our Survey (Exhibit 1.14) in terms of average yearly revenue. Konica Minolta dealers remain in the top spot with an average yearly revenue of $40 million, followed by Canon at $32 million. In third place was Ricoh with $26.6 million. A big factor for all three of these OEMs is the number of $100 million-plus dealers. Ricoh had seven, Canon had four, and Konica Minolta had three dealers with revenues of more than $100 million. Kyocera and Toshiba had one each. One might think that with seven dealers with revenues of more than $100 million, Ricoh’s average dealer revenue would have been higher than $26.6 million, but Ricoh also had 96 respondents compared to 41 for Canon and 43 for Konica Minolta, which yielded a more balanced result. The remaining three Big Six dealers reported average yearly revenues of $10 million and under led by Sharp dealers at $10 million.
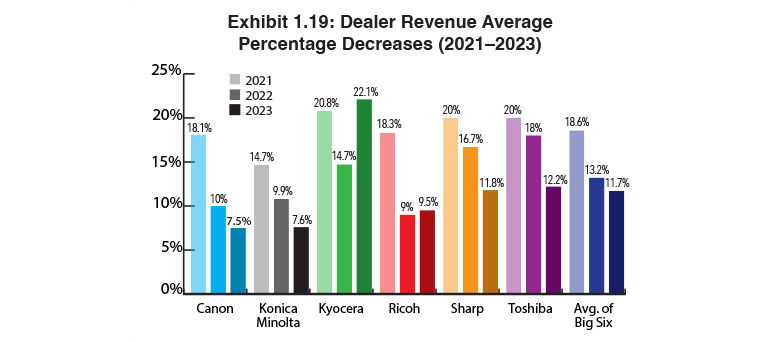
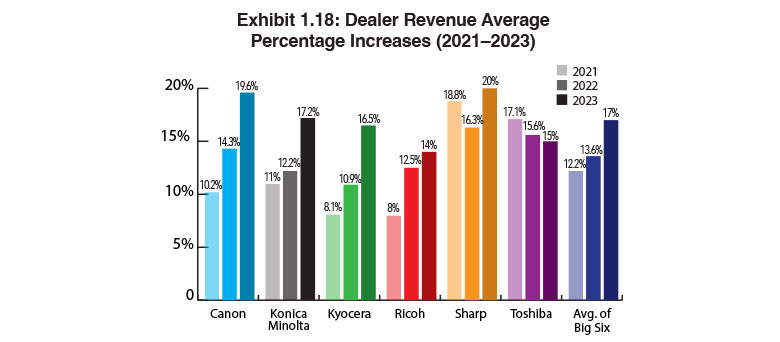
Exhibits 1.18 to 1.19 reveal dealer revenue average percentage increases and decreases, as well as the percentages of those increases and decreases. Overall, the average revenue increase for dealers representing the Big Six was 17% up from 13.6% a year ago (Exhibit 1.18). Two years ago, during the pandemic year, that figure was 12.2%. Supply chain issues aside, the highest revenue average percentage increases reported in our Survey indicate many segments of the dealer channel are thriving.
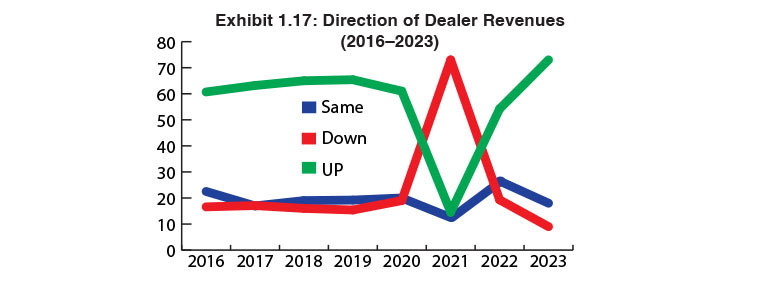
Overall, the percentage of dealers reporting revenue increases has soared to 73% from 54% last year, and a low of 14.5% during the pandemic year (Exhibit 1.17). This is further proof of a healthy industry. The percentage of dealers reporting flat revenues declined from 26.5% last year to 18% this year. An even more positive trend finds that only 9% of dealers reported that their revenues were down compared to 19% last year.
Looking at the average percentage of revenue increases (Exhibit 1.18) by manufacturer, those ranged between 14% and 20% compared to 10.9% and 16.3% across dealers from the Big Six in last year’s Survey. For the fourth consecutive year, Sharp dealers reported the highest average percentage increase at 20%, up from 16.3% a year ago. Sharp’s ability to navigate through the supply chain issues of a year ago is a likely reason for this percentage increase. Arguably, Konica Minolta had a tougher time than most of its competitors with supply chain issues last year. However, that is not reflected in Exhibit 1.18, as its dealers’ revenue average percentage increases rose from 12.2% last year to 17.2% in this year’s Survey.
Ricoh and Toshiba dealers had the smallest average revenue increases at 14% and 15%, respectively. Those percentages may be behind the other OEMs in our Survey, but they are still impressive and you’d be hard-pressed to find a dealer in 2023 who would be disappointed with double-digit growth.
We saw a modest improvement in the number of dealers reporting decreases in revenue (Exhibit 1.19) as the average of the Big Six declined from 13.2% to 11.7% in this year’s Survey. Compare that to the pandemic year when the revenue average percent decrease was 18.6%. Dealers representing Canon, Konica Minolta, Sharp, and Toshiba all did better than last year. Ironically, Kyocera and Ricoh dealers had the highest revenue average percentage decreases this year after reporting the lowest last year. Ricoh dealers saw the average rise from 9% to 9.5% this year, while Kyocera dealers jumped from 14.7% last year to 22% this year. Distorting this percentage is one dealer that saw their revenue decline by 70%. Keep in mind, that the percentage of dealers whose revenues declined (9%) is only a small portion of the overall dealer population—40 out of 458 dealers. Also, we base our revenue average percentage increases and decreases using the number of dealers that provide us with the percentage. For example, 33 of the 40 dealers with decreased revenues provided us with this information.
The revenue results of our 38th Annual Dealer Survey indicate an extremely robust industry, one that has been able to recover from two of the most significant challenges it has ever faced during the past two years—the COVID-19 pandemic and the subsequent supply chain crisis. Going into this year, there was some concern about a recession, but as of this writing, that has not come to pass, and barring any change in that situation, we expect to see dealer revenues hit all-time highs in next year’s Survey.


