Exhibits 1.15-1.23
-Dealer revenue is where we can see most dramatically the impact of the COVID-19 pandemic on the independent dealer channel. It was not a very good year, but it wasn’t as bad as we were thinking prior to reviewing the Survey submissions.
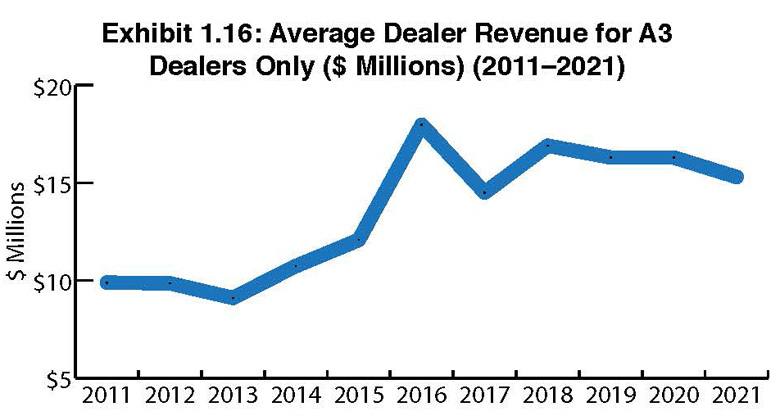
This year, the total dealer revenue of our entire universe of respondents was $5.9 billion. Last year, that figure with 43 fewer dealers participating in the Survey was $5.5 billion. When tabulating overall dealer revenue, we included all 385 respondents, not just the Big Six. The average dealer revenue in this year’s Survey fell from $16.3 million (Exhibit 1.15) in 2020 to $15.3 million in 2021. It could have been worse, and we will speculate that it might have been if not for what we believe was some creative accounting on the part of some of the participants in this year’s Survey. However, since we work on the honor system, we can only present the numbers as reported.
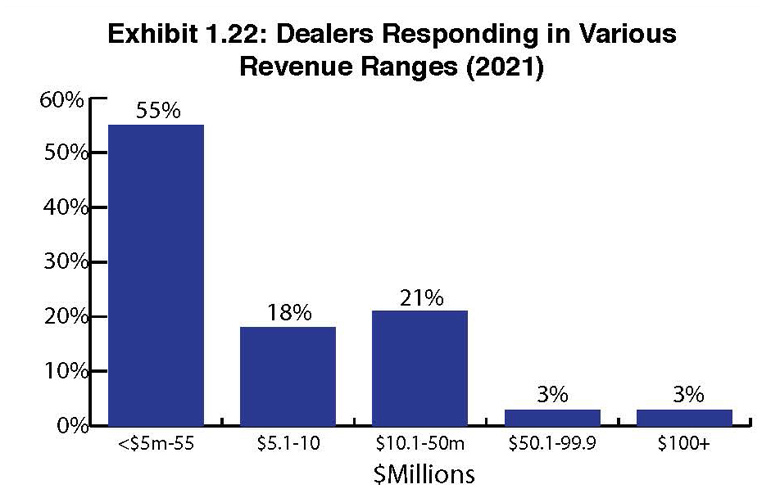
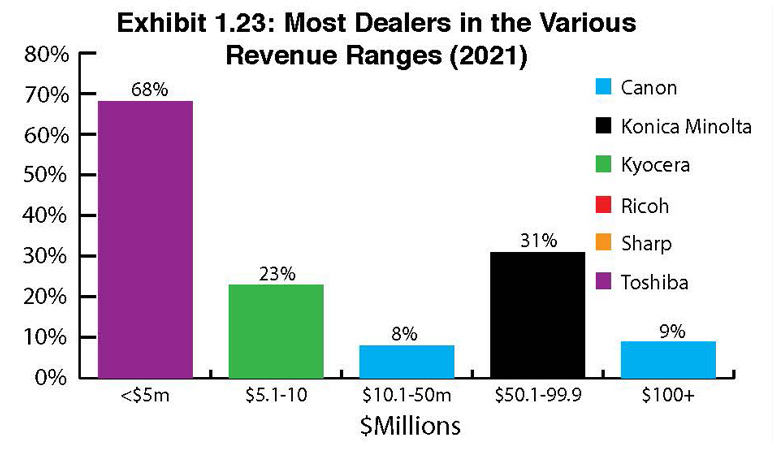
This year’s overall average dealer revenue was 18.6% lower than last year. Another factor in the overall revenue figures is the participation of more dealers with revenues under $10 million. In this year’s Survey, 73% of dealers (283) reported revenues of $10 million or less. They were responsible for 23% of the total aggregate dealer revenue, while the remaining 102 dealers comprised 77%.
This year, 11 dealers (3% of all respondents) reported revenues of more than $100 million compared to 14 last year. These 11 dealers had a total revenue of $2.3 billion representing 35.3% of the $5.9 billion generated by the 385 dealers who participated in this year’s 36th Annual Dealer Survey.
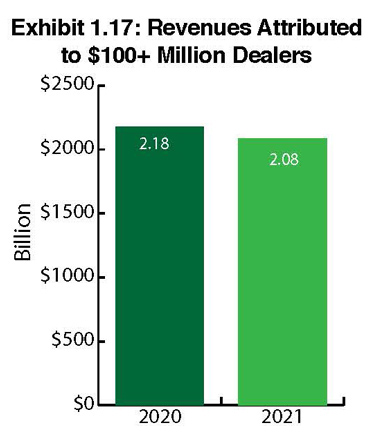
We can also gain additional knowledge by comparing the performance of the dealers generating $100 million-plus revenue in our 35th and 36th Annual Dealer Surveys (Exhibit 1.17). How did these dealers’ 2020 revenue manage to fall only 4.6%? We believe there may be two potential answers. The first has to do with acquisitions, specifically, the acquisition of manufacturers’ MIF for five of these dealers, and an aggressive acquisition strategy for several of them. These dealers took advantage of the pandemic to acquire struggling dealers with reasonable asking prices. The second possibility is that some of these dealers engaged in a little puffery, although it would be hard to say to what extent this occurred. Looking at the larger universe of dealers and trends from 2020, we estimate the revenue loss was closer to 9% on average for larger dealers. Geography also makes a difference here. The top 50 U.S. cities made it very difficult for dealers to compete in the enterprise environment in 2020, as more of their customers’ employees shifted to working from home.
If we eliminate the revenue from those mega $100-million-plus revenue dealers, the remaining 374 dealers reported total revenue of $3.8 billion in revenue for an average of $10.2 million.
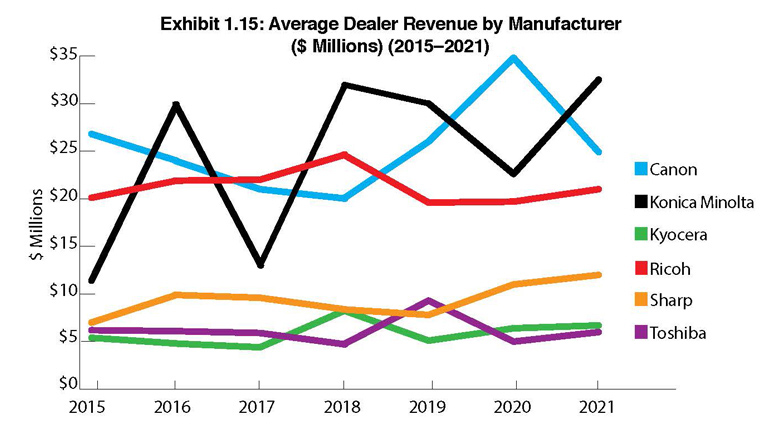
Over the past several years, Canon and Konica Minolta dealers have been going back and forth, swapping places as the most profitable dealers in our Survey (Exhibit 1.15). Last year, Canon held that distinction with $34.8 million. This year, Konica Minolta takes the top spot with $32.5 million, with Canon trailing at $24.9 million. Ricoh dealers weren’t all that far behind at $21 million in average revenues in 2020. Despite the pandemic, Sharp dealers reported slightly higher average revenues per dealer at $12 million, up from a little over $10 million in last year’s Survey.
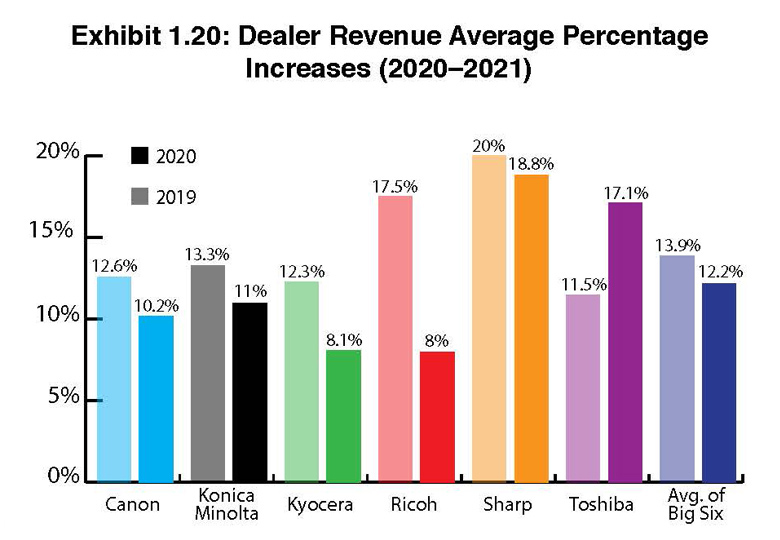
Exhibits 1.18 to 1.23 examine dealer revenue average percentage increases and decreases, as well as the percentages of those increases and decreases. Overall, the average revenue increase for dealers representing the Big Six was 12.2%, down from 13.9% last year (Exhibit 1.20).
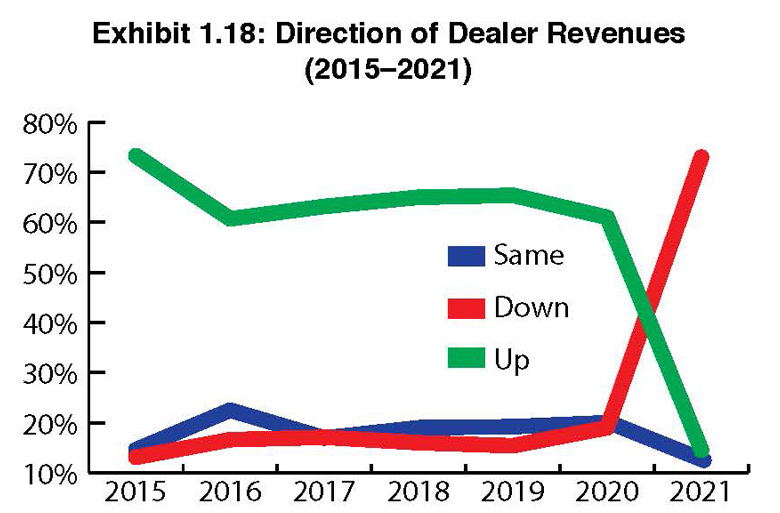
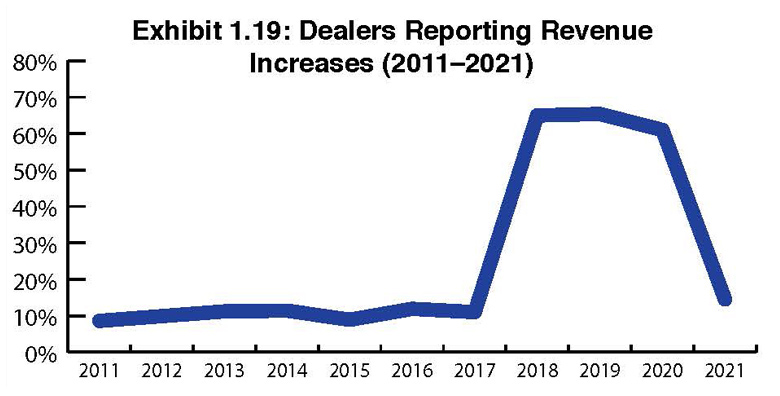
Only 14.5% of the dealers participating in this year’s Survey reported an increase in revenues (Exhibit 1.18). Compare this percentage to the 61% of dealers that reported revenues were up in our previous Survey, and the impact of the pandemic becomes exceedingly profound. That said, the pandemic didn’t prevent dealers from looking for new ways to offset their declines in revenues, and many of these opportunities were rooted in office print. In 2020, dealers became particularly interested in temperature scanners and other technologies related to employee health and safety, as well as security and telephone systems. The percentage of dealers that experienced flat revenues also saw a noticeable decline year over year from 20% last year to 12.5% in this Survey.
This year, 73% of our dealer respondents revealed their revenues were down. That’s 53% more than last year! This is not surprising, and we expect to see a significant rebound in next year’s Survey, simply based on our recent conversations with dealers. Just how much of a rebound? Well, it’s way too early to say, but we wouldn’t be surprised if that 73% drops well below 50% next year.
Examining the average percentage of revenue increases (Exhibit 1.20), those ranged between 8% and 18.8% across dealers from the Big Six in this year’s Survey, with virtually all increases sharply deviating from the previous year. Once again, Sharp dealers reported the highest increases at 18.8%, compared to 20% last year. Ricoh and Kyocera dealers had the smallest average revenue increases at roughly 8%. Remember, these increases were only reported by 14.5% of the total number of dealers responding to our Survey. This year, the dealer revenue average percentage increases for the Big Six was 12.2%, compared to 13.9% last year.
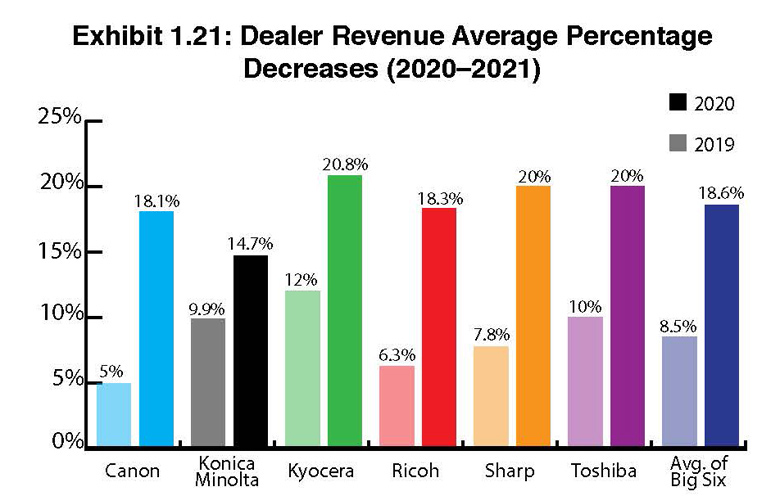
Among the dealers reporting decreases in revenue, the average percentage of revenue decreases (Exhibit 1.21) was significantly higher than in our previous Survey across the board. No dealer from any of the OEMs was left unscathed. Hardest hit were dealers representing Canon, Kyocera, Ricoh, Sharp, and Toshiba, with these dealers reporting average percentage declines of 18.% to 20.8% (Kyocera). Canon dealers (18.1%) saw the biggest swing from year to year, while Konica Minolta dealers saw the average percentage decrease rise from 9.9% in last year’s Survey to 14.7% this year. Not that there were any winners here. The average across the Big Six was 18.6%, a significant increase from the 8.5% average of last year.
This year’s 36th Annual Dealer Survey produced a greater overall revenue compared to the previous year, mainly due to the 43 additional dealers that responded to the current Survey. It is easy to see how important dealers are to manufacturers, but also how tenuous that relationship can be. It is interesting to note that a few of our dealer respondents claim different primary A3 MFP manufacturers from one year to the next. One of the reasons, we have been told, is a competitive situation created by the former primary manufacturer’s direct branch. Another factor is the special marketing programs manufacturers offer each year. The result is the secondary choice becomes the primary selection.
We can learn from this that in many of these instances, the difference to the dealer between the first choice and the second choice is often infinitesimal. That is why we place such importance on the percentage of dealers that are dedicated to a single manufacturer. This data point is very significant. For example, consider a dealer reporting total revenue of $60 million. This dealer also notes that they have three selections for A3 MFPs. The primary manufacturer, in this case, may actually only receive half of the purchases that must be shared with the two other manufacturers. A dedicated dealer with the same total revenue devotes all its resources to sell a single line. Another way to look at this would be a dedicated dealer with only half of the revenue of the multiple-line $60 million business is likely equaling what a dealer twice his size is giving to their first choice.
Access Related Content


