Exhibits 1.36-1.38
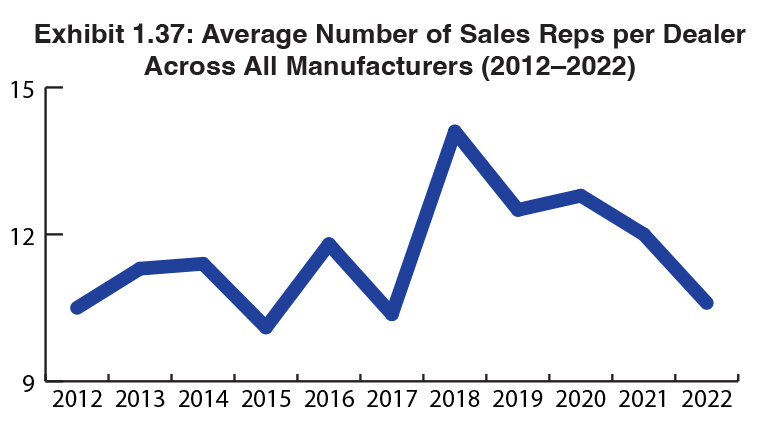
Exhibit 1.37 shows the average number of sales reps per dealer across all manufacturers. We began presenting this data in 2009 during an economic downturn. After seeing a spike in the average number of sales reps from 2009 to 2010, followed by a series of spikes and declines in the following years, including a pronounced spike from 10.37 in 2017 to 14.1 in 2018. Last year, that number had fallen to 12.0 from 12.7 in 2019. This year, even with more larger dealerships participating, the average number of sales reps fell to 10.6. As we’ve pointed out in previous Surveys, sales is a high-turnover profession and even successful dealerships find it difficult to maintain sales personnel. That’s why hiring and retention consistently rank as one of dealers’ top three challenges in our Survey. But there are two other dynamics in play here and that’s the pandemic, which resulted in some dealerships jettisoning their low-performing sales reps during this period, as well as The Great Resignation, which also took its toll on the ranks of sales reps. What remained were the high-performing sales talents who, based on our Survey, rose to the occasion.

To better understand how revenue impacts productivity, we take total dealer revenue and divide it by the average number of salespeople (Exhibit 1.37). We do not distinguish revenues from other sources such as supplies and services. Prior to last year, we included “other” sales or support people in the equation for determining the revenue per salesperson. By including “other” sales or support people as an option, we felt the data more accurately reflected the relationship of dealer sales to revenue. However, as we’ve seen a decline in support personnel, particularly around MPS and now that many dealers have separate divisions for managed IT, we concluded that adding these personnel to the mix was no longer relevant.

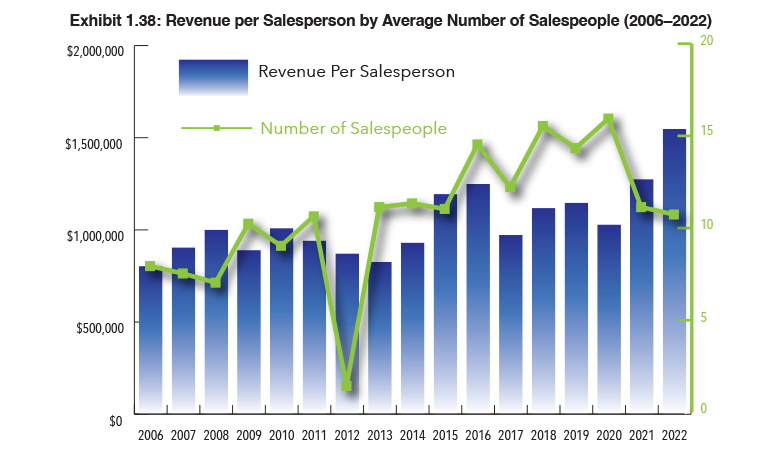
Our intent is still to present a simple way to measure sales productivity and the correlation between the size of a dealer and revenue. Despite the revenue losses caused by the pandemic last year, there was an uptick in revenue per salesperson as shown in Exhibit 1.38 That uptick was even more pronounced in 2021.
In last year’s Survey, the average revenue per sales rep was $1,262,883. This year that figure rose dramatically to $1,547,014. Note that we did not factor in revenues from dealers who did not reveal the number of sales reps they employed. Although we believe the average revenue per sales rep in our past two Surveys should be lower than what is being reported, we adhere to the honesty system with dealers, and unless we spot an obvious example of creative bookkeeping, we use the numbers reported to us. As a result, Exhibit 1.38 depicts the average based on this year’s Survey submissions.

A critical question we need to address is how can the average revenue per sales rep have risen so much over the previous year considering the backorder situation? If you can’t get product, it must be challenging to generate revenues as high as dealers are reporting. The best we can surmise about this situation is that this year’s figure is the result of selling existing inventory that couldn’t be sold during the height of the pandemic, selling products and services not impacted by backorders, and fewer sales reps simply selling more as the average number of sales reps per dealership declined by a headcount of two.
_________________________
To become a subscriber, visit www.thecannatareport.com/register or contact cjcannata@cannatareport.com directly. Bulk subscription rates are also available upon request and included in our media kit.


