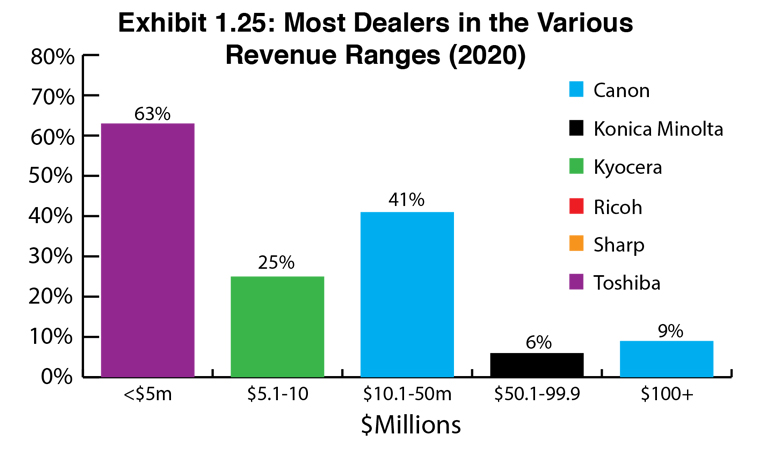
Exhibits 1.17-1.25
Here is where the calm before the storm will be most noticeable in next year’s Survey, as this year’s revenue will serve as a baseline for the radical fluctuations we expect to see in the dealer revenue segment of our 2021 Survey.
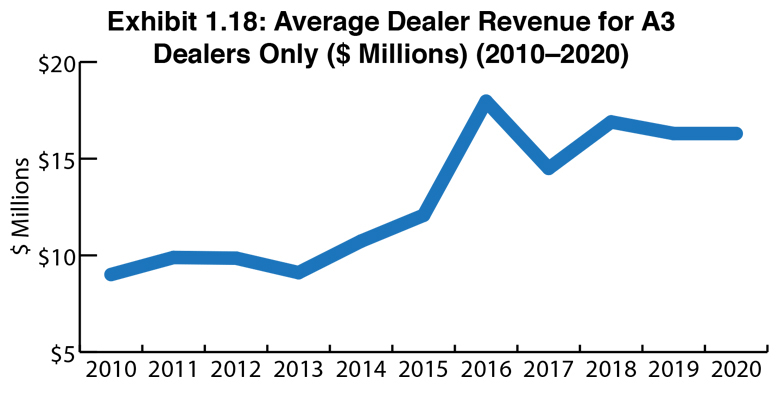
This year, the total dealer revenue of our entire universe of respondents was $5,570,340,000, a modest decrease from last year’s $5,608,696,647. When tabulating overall dealer revenue, we included all 342 respondents, not just the Big Six. The average dealer revenue in this year’s Survey remains consistent with last year, $16.3 million (Exhibit 1.18). That’s down from a high of $16.9 million in our 2018 Survey.
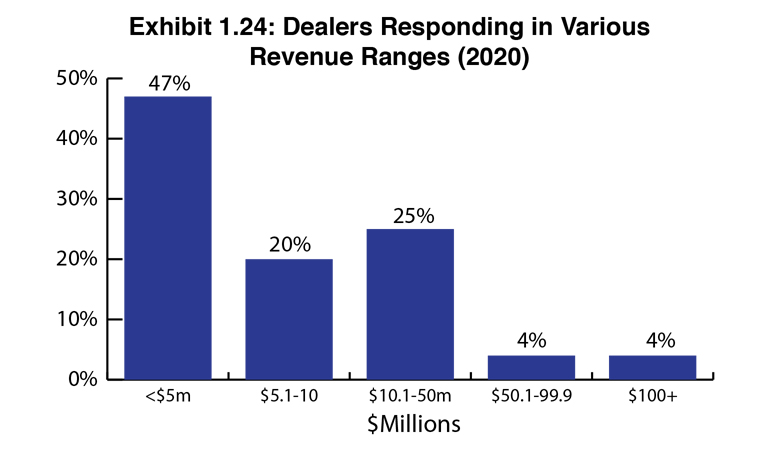
Another factor in the overall revenue figures is the participation of more dealers with revenues under $10 million. Thirty percent of dealers (105) reported revenues of more than $10 million. They were responsible for 80% of all revenue. The remaining 237 dealers were responsible for $866,015,000. That yields an average revenue of $3,654,072.
This year, 14 dealers (4.1% of all respondents) reported revenues of more than $100 million. These dealers accounted for 30% ($2,206,600,000) of all revenue. If you eliminate the revenue from those mega dealers, the remaining 328 dealers reported a total revenue of $3,363,740,000 for an average of $10,255,304.
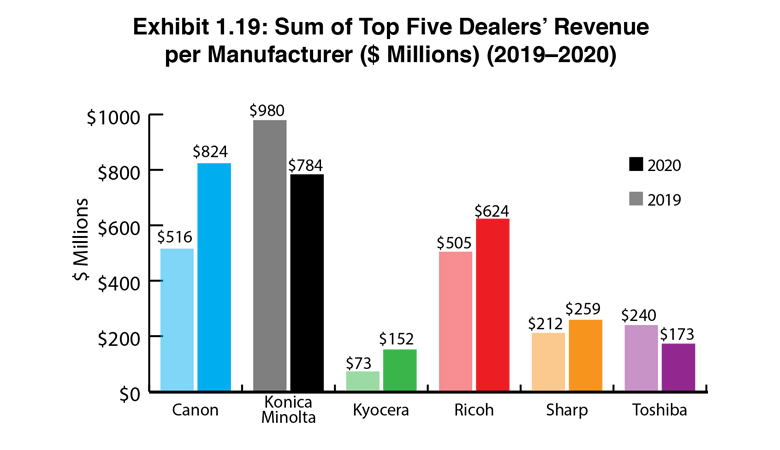
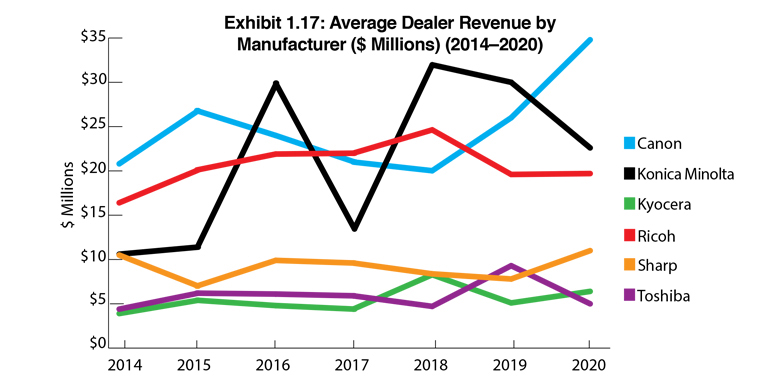
Canon dealers supplanted Konica Minolta dealers as the most profitable dealers in our Survey with average revenues of $34.8 million. The second and third most profitable dealers represent Konica Minolta and Ricoh, $22.6 million and $19.7 million, respectively. We attribute the Canon surge and the Konica Minolta decline in average revenues to a different pool of dealers participating in this year’s Survey. For Konica Minolta, there were more dealers participating with revenues of less than $10 million.
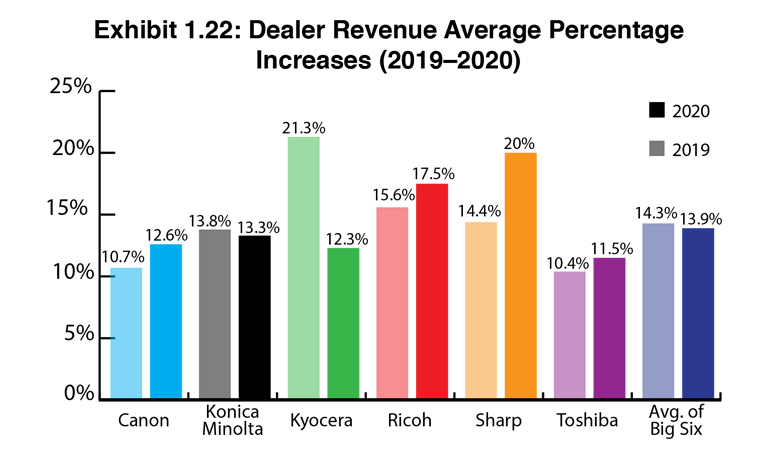
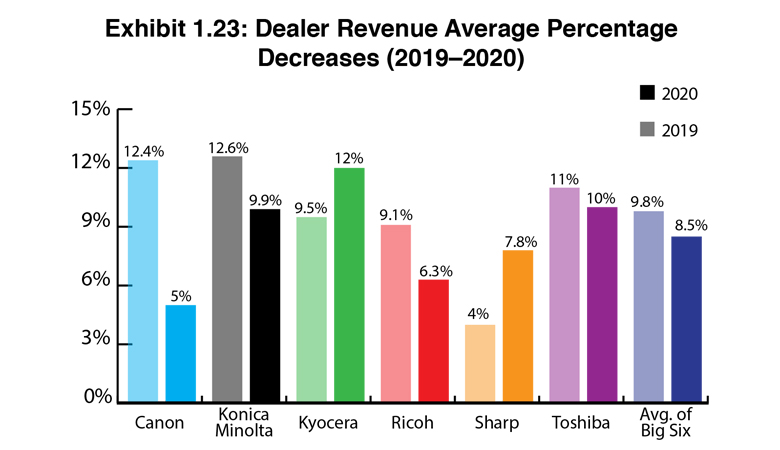
Exhibits 1.20 to 1.25 examine dealer revenue average percentage increases and decreases, as well as the percentages of those increases and decreases. Overall, the average revenue increase for dealers representing the Big Six was 13.9%, down from 14.3% in 2019. Those experiencing a decline in revenues experienced a modest drop from 9.8% in 2019 to 8.5% in this year’s Survey. Note that not all dealers who saw increases or decreases provided percentages so the percentages we are publishing are only based on the dealers who provided them.
We once considered the sweet spot of dealer distribution in the $10 to $20 million range. Last year we decided to expand that sweet spot to $10-$30 million. In our view, expanding the sweet spot offers a more accurate representation of where the industry is today in terms of distribution. Seventy-four (22%) of the 342 dealers participating in the Survey fall into this sweet spot. Canon had the most dealers in this category with 18 (41%), followed by Ricoh with 16 (23%), and Konica Minolta with 13 (25%). Rounding out the Big Six, Sharp had 10 (14%) dealers in this category, Toshiba 9 (17%), and Kyocera 8 (17%).
Last year, we speculated that the decline in dealers within the $10 to $20 million sweet spot may be attributed to acquisitions, which might make that revenue range a sweet spot for those looking to acquire as well. Although some dealers in that range and even larger have been acquired over the past three years, most acquisitions have been of dealers with revenues of $5 million and under.
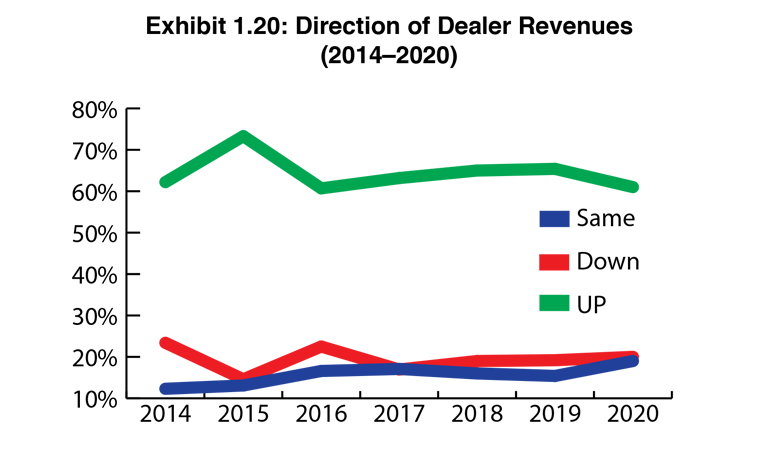
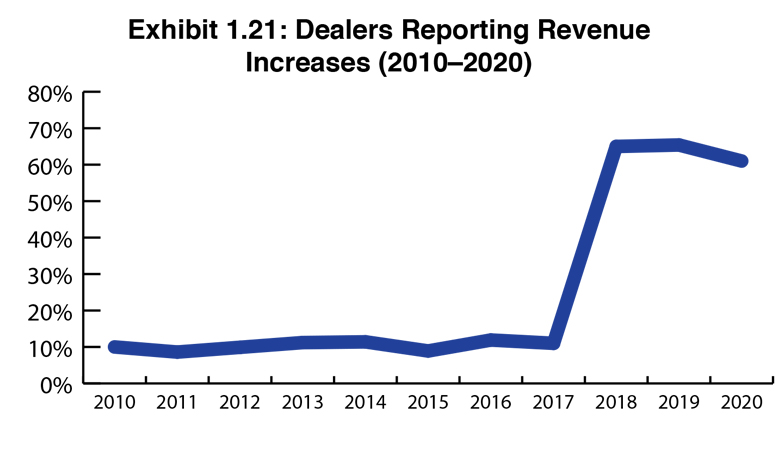
In Exhibit 1.22, we track the direction dealer revenues are heading, and we have found revenues are up for 61% of respondents in this year’s Survey, 4% fewer than in 2019. Overall, that’s still a respectable showing for an industry that is either exploring new and exciting ways to grow revenues or finding a way to grow revenues in their core MFP business. The percentage of dealers who told us their revenues were flat didn’t change all that much from the previous year—20% this year compared to 19%.
For 20% of dealers responding to our Survey, revenues were down. This is a tough business and a challenging time where dealers are taking on new products, and perhaps taking a financial hit as they add new products and solutions to their offerings (Remember, we are referring to 2019 and not 2020 here.). Or they are seeing revenues decline because they remain married to the traditional MPS business, which as we keep reporting, is challenged by tighter margins and declining print volumes. In an industry where acquisitions had been accelerating prior to the pandemic, those dealerships reporting declining revenues may have been seriously considering selling. With most acquisitions on hold in 2020, it is likely that the current economic environment will encourage more dealers to sell once acquisitions activity picks up again.
Examining the average percentage of revenue increases (Exhibit 1.22), increases ranged between 11.5% and 20% across dealers from the Big Six in this year’s Survey with some of the increases sharply deviating from the previous year. Sharp dealers reported revenue increases of 20%, up from 14.4% a year ago. Kyocera dealers saw their average percentage increase in revenue decline from 21.3% in 2019 to 12.3% in this year’s Survey. The remaining OEMs were within 1-2% of last year’s average revenue percentages. The average of the Big Six was 13.9%.
Of those dealers reporting decreases, the average percentage decrease (Exhibit 1.23) was higher than last year for Kyocera (12%) and Sharp (7.8%) dealers. Canon dealers reported the biggest decline in average revenue percentage (5%). Last year that figure was 12.4%. Again, not every dealer who saw a decline provided a percentage. Only 15.4% of dealers participating in our Survey reported revenue decreases. The average of the Big Six was 8.5%.
Access Related Content
Visit the www.thecannatareport.com. To become a subscriber, visit www.thecannatareport.com/register or contact cjcannata@cannatareport.com directly. Bulk subscription rates are also available.


