Exhibits 1.46″“1.47

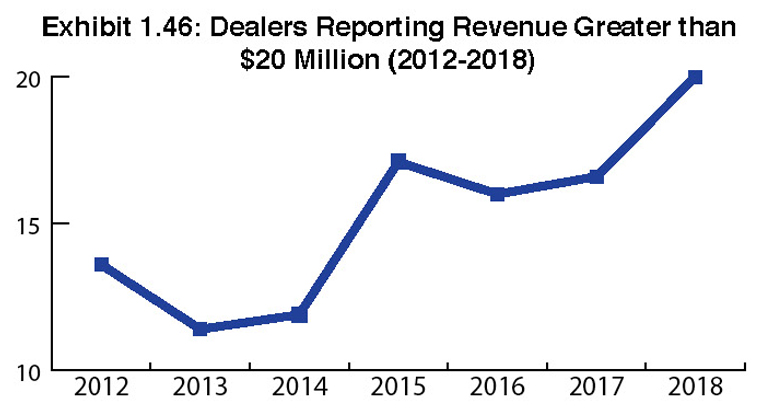
Private-equity money continued to flow into the channel in 2017; Ricoh sold much of its SMB MIF to a select group of dealers, which strengthened their businesses; and mid-sized and larger, well-funded dealers expanded their regional footprints through acquisitions. Further proof that dealers are getting bigger can be seen in Exhibit 1.46, which details the percentage of dealers reporting revenues of greater than $20 million as it increased from roughly 17% in 2017 to 23% in this year’s Survey.
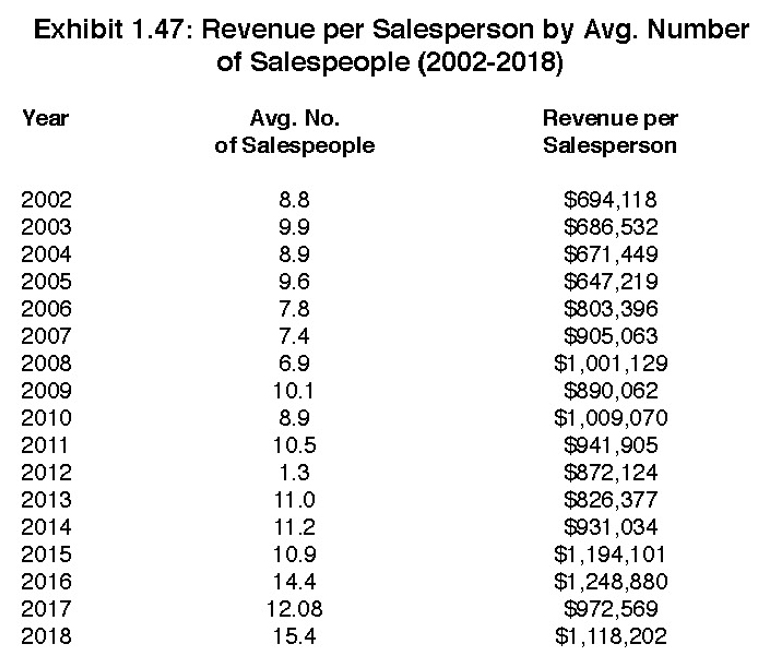
We also examined how revenue has impacted productivity. To better understand our findings in this segment of the Survey, specifically the data shown in Exhibit 1.47, please understand that we continue to analyze this data differently than most surveys conducted by and for the independent dealer channel. Our intent is to present a simple way to measure sales productivity and the correlation between the size of a dealer and revenue. We are confident this method of analysis offers an accurate barometer, particularly when we speak to companies and vendors that have an interest in marketing their products through dealers.
In this instance, we take total dealer revenue and divide it by the total number of salespeople. We do not distinguish revenues from other sources such as supplies and services. As shown in the Survey, the increase in productivity is consistent with the increase of average revenue per dealer even with the price erosion that’s been impacting the channel. Again, we believe this is in line with what represents the cause and effect.
We also combine the “other” salespeople who were responsible for selling MPS and MNS with hardware salespeople, resulting in an increase in the average number of sales employees by 1.3% from 12.8% compared to just factoring in the hardware sales reps reported. As we noted in the previous section of this year’s Survey analysis, as we did in 2017, we continued to see a decline in the number of MPS and MNS sales people in this year’s Survey as compared to our Surveys prior to 2017.
This method of analysis broaches the question of which analytical approach is more accurate or most appropriate for tracking productivity. By including “other” sales or support people as an option, we believe the data more accurately reflects the relationship of dealer sales to revenue. One may say that this could negate the value of our trending perspective, but in our view, this method still best reflects the evolving dealer business model even as the overall number of MPS and MNS sales support staff trends downward.
Comparing our 2018 and 2017 results, the average number of sales people increased from 12.08 in 2017 to 15.4 in this year’s Survey (Exhibit 1.47). The increase can be attributed to this year’s Survey participation of larger dealers that continue to expand their sales forces organically and through acquisitions. After two consecutive years of seeing revenue per salesperson exceed $1 million, that figure fell to $972,569 in 2017’s Survey. This year, that figure rose to $1.1 million, not as high as results from 2015 and 2016, but still a healthy number. Print volumes may be on the decline, but businesses are still spending money, which gives us a strong sense of optimism for the future of the independent dealer channel.
Access Related Content
Visit the www.thecannatareport.com. To become a subscriber, visit www.thecannatareport.com/register or contact cjcannata@cannatareport.com directly. Bulk subscription rates are also available.


