This year’s Survey paints a vivid picture of an industry that’s still thriving in the wake of acquisitions, declining print volumes, and a growing interest in services.
 If there’s one thing you can count on at The Cannata Report is that every year””at least the last 33″”we conduct our annual Survey of independent dealers. It’s a massive undertaking that takes months of refining and updating the questions, then eliciting responses, followed by even more time compiling and analyzing the results. In our opinion, the time and effort involved in bringing these results to our readers is well worth it.
When Frank first conceived of this Survey more than three decades ago, he was looking to provide independent dealers with a forum to share their views about their suppliers and competitors while also acknowledging the manufacturers that had excelled in support of their channel partners. Little did he realize at the time just what kind of impact this Survey would have and how valuable it would become to many in the industry. Since that initial Survey in 1985, The Cannata Report Annual Dealer Survey has become an industry benchmark, a source of trend data and in-depth analysis across the imaging channel that also illuminates the many changes that have impacted the industry for more than three decades.
It’s fascinating to see how the Survey has evolved from its earliest days when the industry was knee-deep in single-function analog systems such as fax machines, electronic typewriters, and even electronic calculators. At the time, those technologies were once considered cutting edge and were still significant revenue generators for independent dealers. Today, it’s a digital world where connectivity is the norm and software, solutions, and services are among the essential offerings. And, as we’ve witnessed in our monitoring of the industry over the years, there’s always a new opportunity rising on the horizon for dealers to sell.
Outside the transition to digital and the emergence of connected devices, expanding into services has been a boon to many dealers. Managed print services (MPS) and managed IT, although still not exactly ubiquitous in the channel, now represent the highest level of participation since we began keeping track of these trends. It is a logical extension for a service-oriented industry to embrace services that complement what they are selling. By adding new technologies, solutions, and services, dealers are strengthening their value to their customers. The more they can provide, the more reason for customers to count on that dealer as their trusted partner, and in some instances, their one-stop source.
A Deeper Understanding
Since the beginning, our primary goal has been to establish a dialog with dealers about their performance parameters and identify areas of greatest interest within the dealer channel. The Survey’s results provide a deeper understanding of how dealers are performing and identify specific areas of concern that their manufacturers need to be aware of, and hopefully will address, if valid. Most of our respondents are honest in their assessments, and as a result, their comments may not always skew towards the positive. However, this constructive criticism and candid observations should be viewed as an asset to other dealers and the manufacturers looking to improve.
By the Numbers
Our Survey questions have been designed to pinpoint where dealers stand in 2018, based on their 2017 performance. When we reference numbers from the 2017 Survey, they represent our dealer respondents’ 2016 performance. When we refer to “last year’s Survey,” we are referring to our 32nd Annual Dealer Survey, published consecutively in our September and October 2017 issues, referencing our dealer respondents’ 2016 performance.
This year, we provided each of the Big Six A3 manufacturers as well as TIAA (EverBank’s parent company) with a link to the Survey. Each then sent the link to their dealers, encouraging them to respond.
The complete results of the Survey are available to subscribers in our October and November 2018 issues, as well as on www.thecannatareport.com. For non-subscribers, the results will be shared only with those who completed every question and provided us with their names and addresses. We cannot send results to dealers who do not identify themselves because the Survey is blind, except to those seeking a free one-year subscription to our media services from TIAA, Canon, Konica Minolta, Kyocera, Ricoh, Sharp, and Toshiba.
Methodology
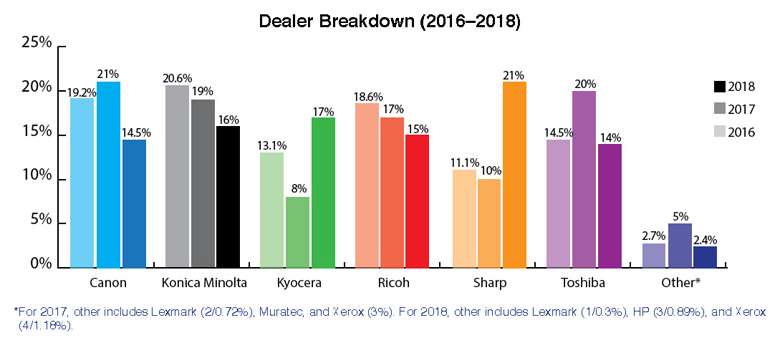
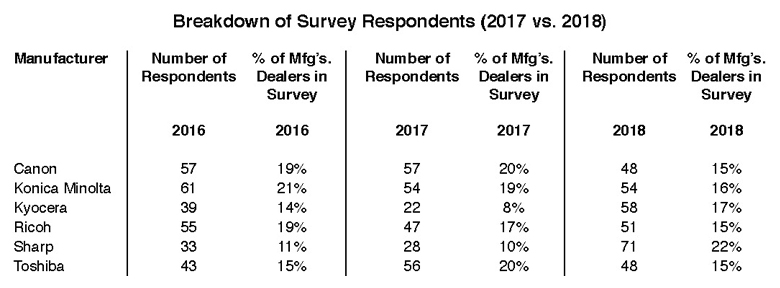
We conducted this year’s Survey online for the fifth consecutive year for easier accessibility and to encourage even more dealers to respond. This year, the Survey yielded 338 responses””62 (18.5%) more than last year””after we deleted duplicates, those with corrupted data, and incomplete submissions. Across the history of the Survey, the numbers from dealers representing the “Big Six” OEMs””Canon, Konica Minolta Business Solutions U.S.A., Inc. (Konica Minolta), Kyocera Document Solutions America, Inc. (Kyocera), Ricoh Americas Corp. (Ricoh), Sharp Imaging and Information Company of America (Sharp), and Toshiba America Business Solutions, Inc. (Toshiba)””tend to vary from year to year. As a result, some years are more balanced than others, with 2016 being one of the most balanced when accounting for OEM population in the history of the Survey. Last year’s Survey was not as balanced as we would have liked due to the modest number of responses from Kyocera and Sharp dealers. This year, we exceeded 2016 on balance and all years in the number of participants representing each of the Big Six, especially given the notable increased participation by Kyocera and Sharp dealers. (Please reference the charts that detail the universe of our 32nd and 33rd Annual Dealer Surveys in this section.)
For the majority of this Survey, we only used the responses from those dealers representing the Big Six, totaling 330. The group labelled “Other” comprises dealers representing HP, Lexmark, and Xerox as primary manufacturers. When we included responses from the “Other” group, we noted the inclusion. For example, all respondents’ views were included in the Survey results related to total revenue, average percentage of revenue, acquisitions, production print, areas of concern, annual dealer meetings, and the award selections that appear in Part II of our Survey issues, published in November.
Because of dealer feedback, it is important to emphasize that we do not weight our responses. All numbers and percentages reported reflect the actual totals we received. As a result, on occasion, as it did last year with a minimal number of Kyocera and Sharp dealers participating, results may be somewhat skewed, but when that does happen, it is noted in our analysis. However, we’d like to underscore that because of this year’s balanced number of respondents across dealers in the Big Six, our results are also balanced accordingly.
Variables and Variations
Each year, as best as we can, we attempt to avoid making any assumptions about the results of the Survey before we’ve tabulated all the responses. That’s a potentially dangerous exercise, and as we’ve experienced, preconceived notions of what the Survey will reveal, or how the numbers might play out based on previous year’s results, has sometimes proven out wrong. However, oftentimes, the results are in line with our educated predictions, which are based on our ongoing dialog with the dealer community throughout the year. At the same time, we do our best to be objective going into each Survey, and are often pleasantly surprised, and even excited, by what we discover.
Occasionally, differences can vary widely from the previous years. These discrepancies often can be traced to the number of respondents representing a specific manufacturer as we noted earlier. Other times, it could reflect a different pool of Survey respondents, even though there is a sizable segment of the dealer community that participates in the Survey every year. Variations among results may also indicate a trend that is emerging must faster than originally anticipated. However, most trends that have captured the imagination of our industry have taken a few years to take hold in the dealer channel, which isn’t all that surprising as most respondents take a more conservative approach when adopting new products and services.
We are thrilled by the response to this year’s Survey compared to years past in terms of the number of participants. Honestly, it did exceed our expectations. Because of that, and the overall balance, we believe this year’s Survey offers the most valuable and valid data of any Survey we’ve ever presented.
With all the acquisitions taking place across the industry, including 121 by 70 different dealers in this year’s Survey, one might expect the number of participants in our Survey to have declined, but that didn’t happen. With greater participation across dealers, we also saw a slight uptick in the number of dedicated dealers from 33% last year to 36% in this year’s Survey.
Overall, the Survey vividly illustrates an industry in transition, yet despite consistent changes, which pose a challenge for many, we see a business that remains profitable and growing for a significant number of dealers. At the same time, we do continue to see the gulf in revenue between the largest dealers and the smallest widen as the number of acquisitions, particularly by the larger players, accelerate. Still, even for smaller dealers that have established their niches, our Survey reveals this industry still provides a wealth of opportunities, despite the current challenges and ongoing shifts shaping the industry.
Acknowledgements
We extend deep thanks to our business partners, beginning with TIAA, which officially sponsored the Survey for the fifth consecutive year, as well as Canon, Konica Minolta, Kyocera, Ricoh, Sharp, and Toshiba, which provided subscription incentives in support of this year’s Survey. We could not have been nearly as successful without their help in soliciting dealer responses.
In addition, we thank the following dealer groups, BPCA, CDA, and SDG, for encouraging their members to participate. The support of these three groups has increased the number and enhanced the quality of responses. The team at The Cannata Report appreciates the relationship we have with each of these organizations, as well as with our manufacturer and leasing partners.
Let the Survey begin.
Access Related Content
Visit the www.thecannatareport.com. To become a subscriber, visit www.thecannatareport.com/register or contact cjcannata@cannatareport.com directly. Bulk subscription rates are also available.


