Exhibits 1.18″“1.27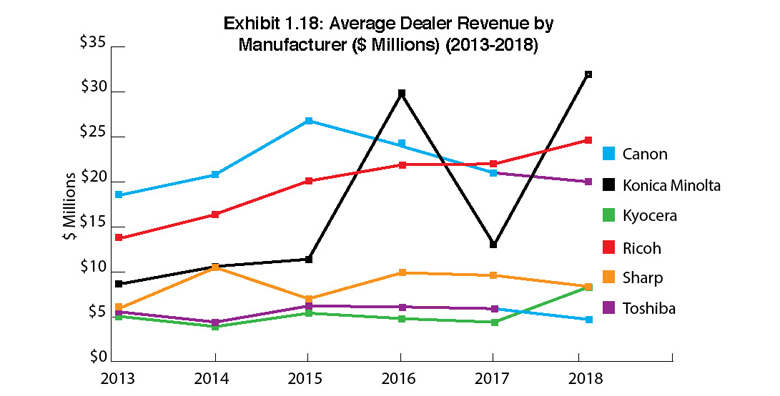
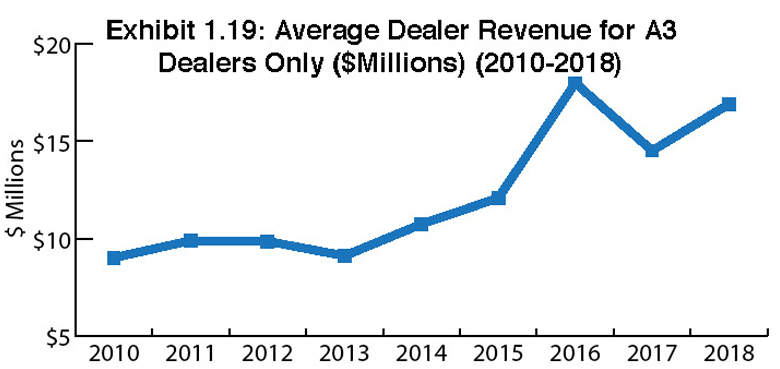
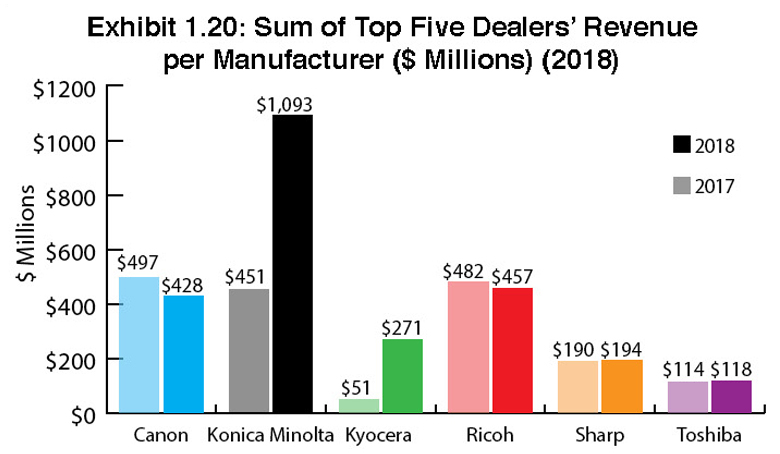
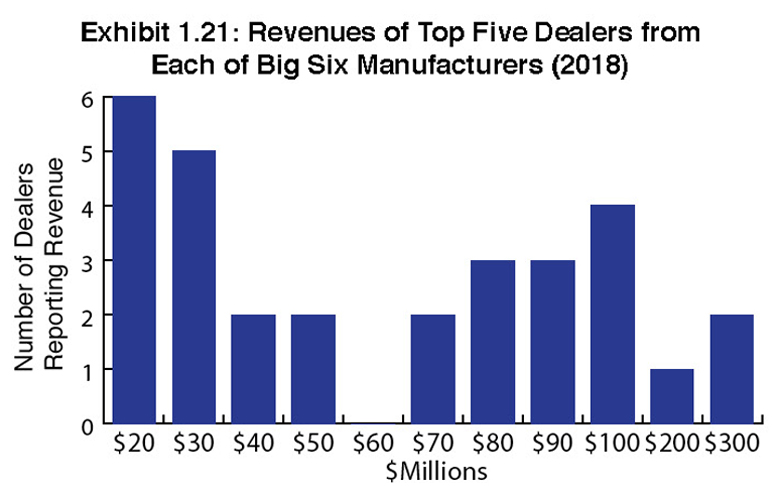
When analyzing our Survey results, we do not base our findings on profitability and choose to examine revenue. This year, the total dealer revenue of our entire universe of respondents grew to $5,717,370,000. In 2017, that number was $4,030,954,987, representing an increase of $1,686,415,013 in 2018. The average dealer revenue in this year’s Survey is an impressive $16.9 million (Exhibit 1.19). When tabulating overall dealer revenue, we included all 338 respondents, not just the Big Six. The reason for this was because three of the eight dealers outside the Big Six are large legacy dealers with revenues of $108, $150, and $200 million, respectively, and whose presence and impact on the industry are significant.
Konica Minolta dealers enjoy average revenues of $31.97 million, largely due to two dealers that reported more than $300 million in revenues. Ricoh and Canon dealers, as a group, are equally strong in average yearly revenues with $24.63 million and $20.02 million, respectively.

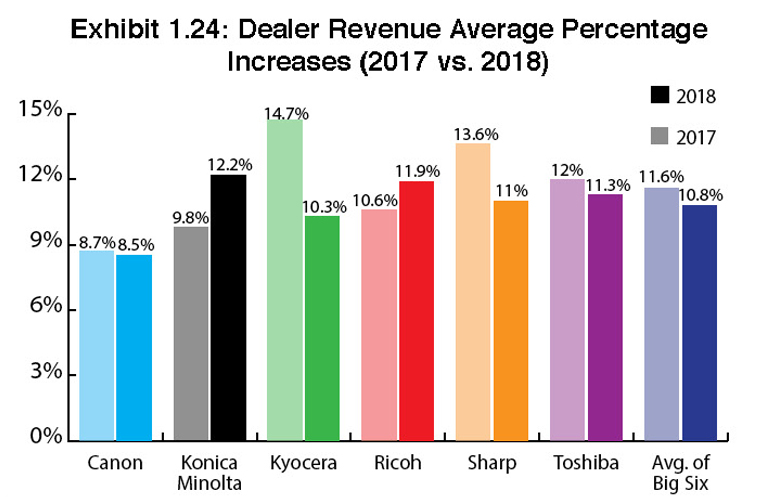
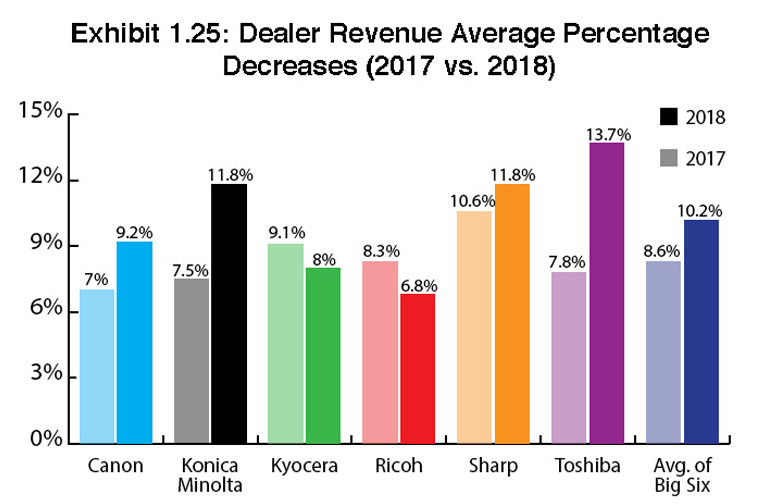
 Exhibits 1.24 and 1.25 examine dealer revenue average percentage increases and decreases, respectively. Overall, revenues for those dealers representing the Big Six saw an average increase of 10.8%, while those experiencing a decline in revenues saw a drop of 10.2%. We’d like to highlight the deviation in Exhibit 1.25 with Toshiba, where one dealer reported the company was down by a sizable 60%. This was a dealer whose revenue was only $1.1 million the previous year. Eliminating that dealer from the mix lowers the average percentage of revenue decrease for Toshiba dealers from 13.7% to 9.4%, and the average decrease across the “Big Six” to 9.08%.
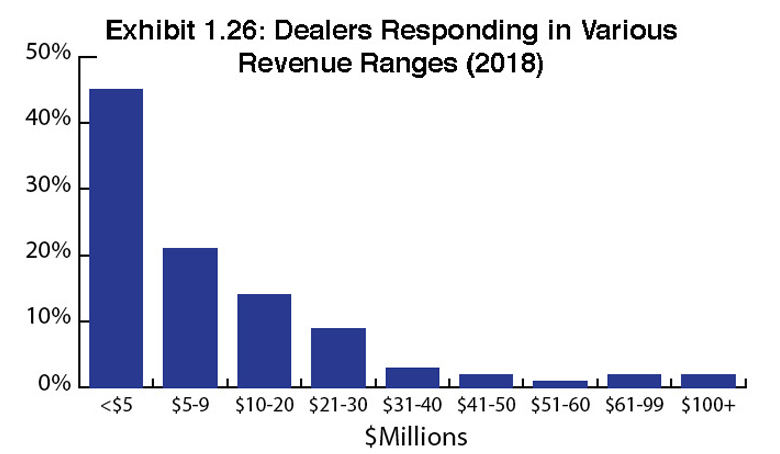
In the past, we viewed the sweet spot of dealer distribution in the $10 to $20 million range. In this current Survey and in 2017, only 14% of dealer respondents fall into that range. If we were to expand the sweet spot to $10 to $30 million in our current 2018 Survey, that figure jumps to 23%. If we had done the same last year, that number would have been only 16%. We believe expanding the sweet spot offers a more accurate representation of where the industry is today in terms of distribution. Ricoh led the way with 37% (19 of 51) of its dealer respondents falling inside this sweet spot of $10 to $30 million, followed by Canon with 33% (16 of 48) of its dealer respondents. Kyocera and Sharp did much better than we thought they would with Kyocera having 21% (12 of 58) of its dealer respondents and Sharp having 20% (14 of 71) of its dealer respondents within this sweet spot. Rounding out the Big Six, Konica Minolta had 15% (8 of 54) of its dealer respondents and Toshiba had 12% (12 of 48) of its dealer respondents in this revenue range.
Last year, we speculated that the decline in dealers within the $10 to $20 million sweet spot may be attributed to acquisitions, which would make that revenue range a sweet spot for those looking to acquire as well. Although we’ve seen some dealers in that range and even larger be acquired over the past two years, many of the acquisitions we’ve seen this year thus far are still centered on dealers in the $5 million-and-under revenue range. This trend holds true whether it’s with Visual Edge, Marco, or manufacturers such as Sharp doing the acquiring.
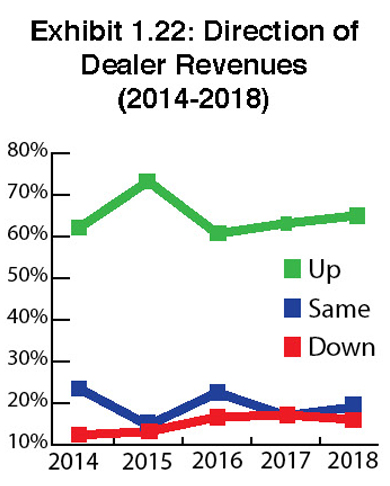
In Exhibit 1.22, we note the always fascinating direction dealer revenues are heading, and we have found revenues are up for 65% of respondents in this year’s Survey compared to 63% in 2017. That 2% difference between 2017 and 2018 can be attributed to the number of dealers reporting an up year for 2018, but had reported a decline in 2017. For 19% of our dealer respondents, revenues hadn’t changed year over year. Turning the clock back 10 years to 2008, only 18% of respondents reported an increase in revenues, indicating just how far this industry has come since the start of the financial crisis.
Drilling deeper into the average percentage of revenue increases (Exhibit 1.24), we found increases ranged between 8.5% and 12.2% across dealers from the Big Six in 2018, not deviating all that greatly from last year. Konica Minolta dealers experienced the biggest bump, up from 9.8% in 2017 to 12.2% in 2018, while Kyocera dealers dropped from 14.7% in 2017 to 10.3% in 2018. We believe that Kyocera’s 10.3% this year is more accurate than 2017’s figure, as only 22 Kyocera dealers participated in our 2017 Survey compared to 58 this year.
Of those dealers reporting decreases, the average percentage decrease (Exhibit 1.25) was higher than last year for Canon dealers (9.2% in 2018 versus 7% in 2017), Konica Minolta dealers (11.8% in 2018 versus 7.5%), Sharp dealers (11.8% in 2018 versus 10.6% in 2017), and most notably Toshiba dealers (13.7% in 2018 versus 7.8% in 2017). We might attribute the decline among Toshiba dealers to the volatile financial situation with Toshiba in Japan and some of the negative press the company has received because of it. However, it seems that Toshiba TEC, Toshiba’s parent company in Japan, seems to be traveling on a less rocky road today, based on what we learned during our visit to Japan this past May. That said, it will be interesting to see what happens with Toshiba dealer revenues in our next Survey and whether they can rebound now that the company’s financial situation has stabilized.
We continue to see larger dealers grow their revenues, which isn’t surprising considering they have the resources to invest in talent and new opportunities. In 2017, we predicted most dealers with revenues above $50 million will continue to see their revenues increase, and the number of $100 million and $200-plus million dealers in the overall dealer population will continue to grow. This year, we had 7% (24) dealers report more than $50 million in revenues. Among that group, 75% (18) saw revenue increases, while 17% (4) experienced a decline and 8% (2) reported similar revenues to the previous year.
Access Related Content
Visit the www.thecannatareport.com. To become a subscriber, visit www.thecannatareport.com/register or contact cjcannata@cannatareport.com directly. Bulk subscription rates are also available.

